Figure 1.
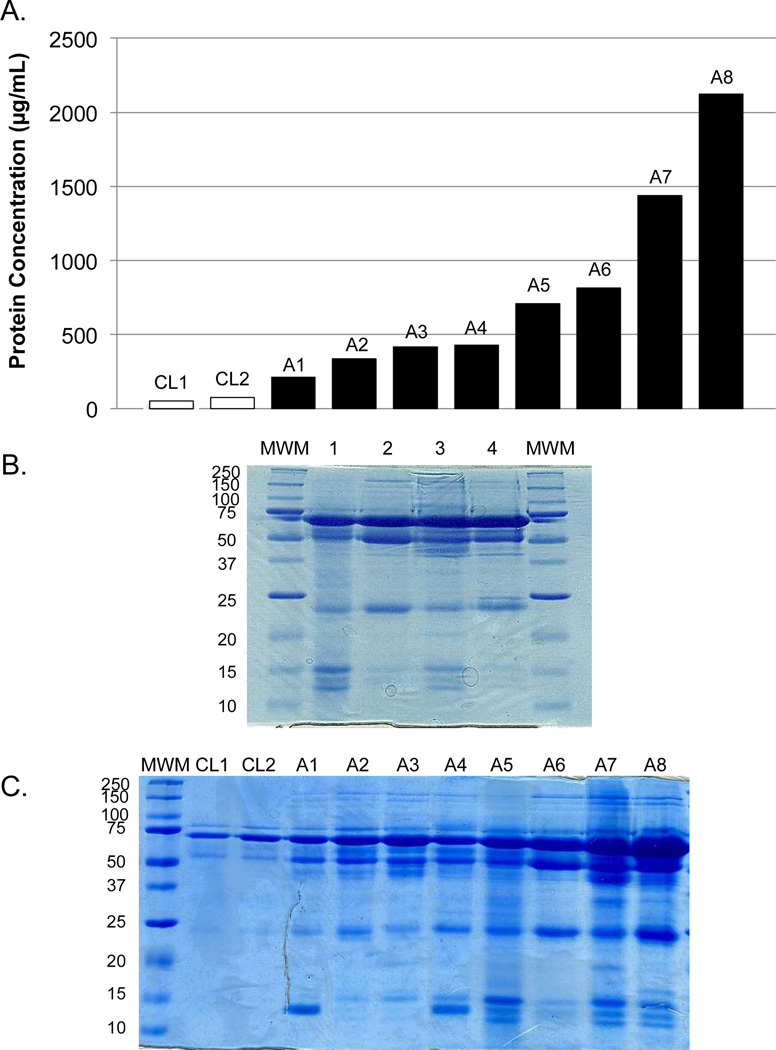
Gel electrophoresis (12.5%) of BALF proteins illustrates heterogeneity across samples. (A) The associated protein concentration of each sample. (B) Coomassie-stained gel of representative ARDS BALF samples (1–4). An equal amount of protein (30µg) was loaded for each sample. (C) Coomassie-stained gel of representative control and ARDS BALF samples loaded by volume. MWM = molecular weight marker; A = ARDS.

