Abstract
Molecular oxygen has profound effects on cell and tissue viability. Relevant sensor forms that can rapidly determine dissolved oxygen levels under biologically relevant conditions provide critical metabolic information. Using 0.5 μm diameter electrospun polycaprolactone (PCL) fiber containing an oxygen-sensitive probe, tris (4,7-diphenyl-1,10-phenanthroline) ruthenium(II) dichloride, we observed a response time of 0.9±0.12 seconds – 4–10 times faster than previous reports – while the t95 for the corresponding film was more than two orders of magnitude greater. Interestingly, the response and recovery times of slightly larger diameter PCL fibers were 1.79±0.23 s and 2.29±0.13 s, respectively, while the recovery time was not statistically different likely due to the more limited interactions of nitrogen with the polymer matrix. A more than 10-fold increase in PCL fiber diameter reduces oxygen sensitivity while having minor effects on response time; conversely, decreases in fiber diameter to less than 0.5 μm would likely decrease response times even further. In addition, a 50°C heat treatment of the electrospun fiber resulted in both increased Stern-Volmer slope and linearity likely due to secondary recrystallization that further homogenized the probe microenvironment. At exposure times up to 3600 s in length, photobleaching was observed but was largely eliminated by the use of either polyethersulfone (PES) or a PES-PCL core-shell composition. However, this resulted in 2- and 3-fold slower response times. Finally, even the non-core shell compositions containing the Ru oxygen probe result in no apparent cytotoxicity in representative glioblastoma cell populations.
Keywords: nanofiber, co-axial, cytotoxicity, oxygen probes, bleaching
1. Introduction
Molecular oxygen, a species essential to the function of the human body, has profound effects on cell and tissue behavior and viability.[1]_ENREF_1 Although air enters the lungs at atmospheric oxygen partial pressures of 21%, oxygen levels in arterial blood are only about 12%.[2] Cells in vivo see relatively constant O2 levels ranging from approximately 2% (mesenchymal stem cells) to 5% (cardiomyocytes) depending on the region and proximity to a capillary. As a critical condition in engineered tissue growth, oxygen diffusion limits the spatial distribution and migration of cells by poorly understood mechanisms governing cell response to oxygen gradients.[3]
Sensors that can determine dissolved oxygen levels under biological conditions provide critical metabolic information. Traditional electrode-based sensors suffer from the invasiveness of the measurement, an inability to be used in studies of individual cells, and oxygen consumption by the electrochemical reduction itself.[4] Such sensors are also limited to single-point measurements and cannot reveal either 2D or 3D oxygen distributions in heterogeneous systems. Optical sensors based on the quenching of a luminophore have attracted attention due their potential to be non-invasive, more easily miniaturized, integrated with cell culture devices, lack of oxygen consumption and freedom from electrical interference.[5] Oxygen sensitive ruthenium complexes such as tris (4,7-diphenyl-1,10-phenanthroline) ruthenium(II) ([Ru(dpp)3]2+) have been used due to their quantum yield, oxygen sensitivity, large Stokes shifts and thermal stability at physiological temperatures.[6] These probes are usually immobilized in a matrix to prevent optical interference, reduce toxicity and provide mechanical strength. The ideal matrix should have acceptable optical properties, excellent oxygen permeability and be a good solvent for the luminophore.[5] Various materials have been explored as thin film matrices: polystyrene, polyvinyl chloride, polymethyl methacrylate, organically modified silicate, sol-gel and silicones.[7–13] For sensors directed toward biological applications, additional properties such as non-toxicity and good biocompatibility are desirable. In this context, polycaprolactone was chosen for this work as a candidate matrix material. It provides excellent biocompatibility as well as satisfactory oxygen permeability. Another polymer, polyethersulfone, was also investigated due to its thermal and chemical stability and good optical properties.[14] In addition, given that these nanofibers are targeted for use with cancer cell populations we tested the cytotoxicity of probe-containing PCL nanofibers utilizing glioblastoma cell populations that have been previously cultured successfully on PCL nanofibers.[15]
In contrast to film formation, electrospinning is a versatile technique producing nano-scale fiber scaffolds that already see a wide variety of applications in regenerative medicine.[16] For example, previous studies from our group successfully utilized these electrospun fibers to establish a physiologically relevant model of glioma cell migration and to develop screening assays for anti-invasive compounds[15, 17] Here, we combine this fiber-based platform with an oxygen-sensitive ruthenium compound to develop a nano-fiber based optical oxygen sensor. The sensor is capable of responding rapidly to changes in the oxygen content of the surrounding gaseous/aqueous environment. More importantly, this platform could easily be applied to a variety of matrices and probes and can be readily integrated to tissue culture plates or bioreactors, providing an alternative to the standard optical oxygen sensor family. In addition, a core-shell configuration explored as a nanofiber sensor provides additional benefits as will be discussed.
2. Materials and methods
2.1. Materials
Polycaprolactone (Mn=70,000–90,000) and dichloromethane were purchased from Sigma-Aldrich (St. Louis, MO, USA) and polyethersulfone was obtained from Goodfellow (Huntingdon, England). Tris (4,7-diphenyl-1,10-phenanthroline) ruthenium(II) dichloride was acquired from Alfa Aesar (Ward Hill, MA, USA). 1,1,1,3,3,3-hexafluoro-2-propanol (HFP) was obtained from Oakwood Products Inc. (West Columbia, SC, USA).
2.2. Preparation of oxygen sensitive fibers
The oxygen sensitive probe, [Ru(dpp)3]2+, was dissolved into HFP; this orange-colored solution was stirred at room temperature for 20 minutes to fully dissolve the probe. The electrospinning solution was prepared by continuously stirring either 5wt% PCL or 8wt% PES polymer pellets into this solution at 55°C until polymer dissolution was complete. The weight ratio of the oxygen probe and carrier polymer was held constant at 1:1000. After cooling to room temperature, the uniformly mixed solution was electrospun according to procedures used previously.[18, 19] The large diameter PCL fibers were fabricated by using dichloromethane (DCM) as the solvent. The typical sample thickness (approximately 100 μm) for sensing applications was held constant by fixing the deposition time at 400 seconds. The as-spun fiber sheet was then placed in a vacuum overnight to ensure removal of residual solvent.[20]
In addition, a “shell” containing no luminophore was added to these oxygen sensitive fibers by simultaneous co-axial electrospinning of two polymer solutions through two concentric blunt needles. 5 wt% Ru probe-containing PES solution (Ru:PES = 1:1000 ratio by weight) was electrospun as the “core” while 5 wt% PCL solution was electrospun as the “shell.” The flow rates for PES and PCL solutions were both 4 ml/h and the applied voltage 25 kV. For the sake of comparison, conventional film-based sensors were also prepared using the same polymer and probe solutions by casting onto a glass slide. All samples were stored within completely dark containers prior to characterization or testing.
2.3. Microscopy and image analysis
Scanning electron microscopy (SEM; XL30 ESEM, FEI Company, Hillsboro, OR, USA) was used to examine the morphology of the probe-containing fibers following the application of a 100 angstrom-thick gold coating by a sputter coater (Pelco, Clovis, CA, USA). The luminescent properties of the fibers were studied by capturing fluorescent images on a fluorescence microscope (Eclipse, Nikon Inc. Melville, NY, USA) with a filter set for red fluorescence (EX: 530–560 nm, DM: 570 nm, BA: 590–650 nm). The exposure time for each image was 400 ms and the fluorescence intensity of the red channel in the images was measured in randomly selected areas using NIH ImageJ.
2.4. Optical spectroscopy
The fluorescence spectrum measurements of the fibers and the continuous monitoring of the emission peak were conducted by a fluorescence spectrometer (JAZ, Ocean Optics Inc., Dunedin, FL, USA). Blue LED light at 470 nm used as the excitation wavelength was guided through 600 μm VIS-NIR fibers. The optic fiber probe was positioned perpendicular to the electrospun mats and the collected signal delivered to the spectrometer to either display the resulting spectrum or to conduct time-based measurements at a particular wavelength.
2.5. Measurements of gaseous oxygen
Sensing performance was first examined by monitoring atmospheric oxygen. Electrospun fiber mats were glued to the inner wall of fixed cuvettes with the probe of the spectrometer oriented perpendicularly to the sample. A glass tube connected to a gas mixer (Omega Engineering, USA) was inserted and placed at the bottom of the cuvette. The oxygen gas concentration was controlled by adjusting the relative flow rates of oxygen and nitrogen gas. As oxygen flow rates increased from 0 to 100% at 10% increments the emission spectra was recorded. To examine reversibility and response time, the cuvette was first filled with pure oxygen and was then alternated with pure nitrogen at 20 s intervals. High gas flow rates (1450 cc/min) were used to rapidly alter the atmosphere around the sample and minimize measurement error. The intensity of the emission peak was measured continuously as function of time.
2.6. Measurements of dissolved oxygen
Oxygen sensitivity tests of the fibers in more relevant aqueous solutions were then conducted in a transparent chamber containing a 1×1 cm sample of oxygen sensing fiber. The desired oxygen concentrations were controlled by sparging defined ratios of mixed gases into the water within the chamber. Oxygen and nitrogen gases were merged to a tube inserted in the chamber and flow rates maintained by a proportioner for 30 minutes prior to measurement to ensure equilibrium. Real-time dissolved oxygen concentration was monitored using a commercial oxygen meter (Hach Company, Loveland, Colorado, USA) to provide calibration. The position of the gas outlet is ~2 cm away from both the oxygen meter probe and the sample to reduce interference effects potentially generated by the gas flow. The change in fluorescence intensity was monitored by the fluorescence spectrometer at the emission peak. For tests of reversibility, water was simply bubbled and saturated with either pure nitrogen or pure oxygen. The fluorescence intensity change was determined by measuring the images taken by the fluorescence microscope.
2.7. Cell culture experiments
To establish whether these oxygen-sensing fibers were cytotoxic to cells representative of the intended application, cell culture experiments were performed with the glioblastoma cell lines U251MG and CNS1. U251MG cells were cultured in Dulbecco’s modified Eagle’s medium (containing 4.5 g/L glucose) while CNS1 cells were cultured in RPMI-1640 medium (containing 2 mM L-glutamine). In both cases, the medium was supplemented with 10% fetal bovine serum, 50 UI/ml penicillin and 50 μg/ml streptomycin. Cells were gently dissociated when they reached 80% confluence and seeded at an average density of 10,000 cells/well in 24-well plates with PCL alone or probe-containing PCL (Ru-PCL) nanofiber-coated plates. Cells were cultured for 48 hours and subsequently stained with Calcein-AM (1 μg/mL, Invitrogen) and propidium iodide (0.5 μg/mL, Invitrogen), following standard protocols. Cells were analyzed by fluorescence microscopy to identify live (calcein-positive, green fluorescence) and dead (PI-positive, red fluorescence) cells. Image analysis and quantification were performed using ImageJ (v.1.47) software.
3. Results and discussion
3.1. Morphology and dimensions of Ru probe-containing fibers
The Ru probe was very soluble in HFP and a uniformly orange-colored solution was formed when the Ru probe and polymer pellets were fully dissolved. Electrospinning created nano- and micro-scaled fibers (Table 1) containing this oxygen sensitive probe in a single-step process. Fibers could be formed either as a randomly oriented structure (Figure 1a, b) or in an aligned format (Figure 1c) depending on the set-up employed for the electrospinning process. Probe-containing fiber diameters can be adjusted by varying polymer concentrations.[21] The morphology of these oxygen-sensitive fibers is indistinguishable from that of probe-free fibers. SEM images (Figure 1a, b) show the typical high porosity associated with electrospun fiber mats. The PES fibers display slightly larger interfiber spacing likely reflective of their relatively higher initial modulus (even when solvent is still present) preventing closer fiber approach as the fiber falls. These increased surface-to-volume ratios (compared to traditional film-based sensors) should dramatically reduce barriers to efficient oxygen diffusion as the fiber diameter provides a relatively small barrier. Such 3D structure is also important for application in reporting localized oxygen levels near individual cells as these nanofibrous structures simulate the extracellular matrix (ECM) topography to allow for close interaction of cells with the matrix and the incorporated oxygen-sensitive probes.
Table 1.
Response and recovery time versus fiber diameter and composition.
| Fiber | Solven | Polymer Concentration | Diameter (μm) | Response time(s) | Recovery time(s) |
|---|---|---|---|---|---|
| PCL | HFP | 5 wt% | 0.53±0.32 | 0.9±0.12 | 1.98±0.37 |
| PES | HFP | 8 wt% | 0.72±0.43 | 2.17±0.28 | 2.43±0.18 |
| PES-PCL core shell | HFP | 5 wt%/5 wt% | 0.96 ± 0.32 | 2.91± 0.33 | 3.33± 0.48 |
| Larger diameter PCL | DCM | 10 wt% | 7.01±1.37 | 1.79±0.23 | 2.29±0.13 |
| PCL film | HFP | 5 wt% | - NA - | ~150 | ~400 |
Figure 1.
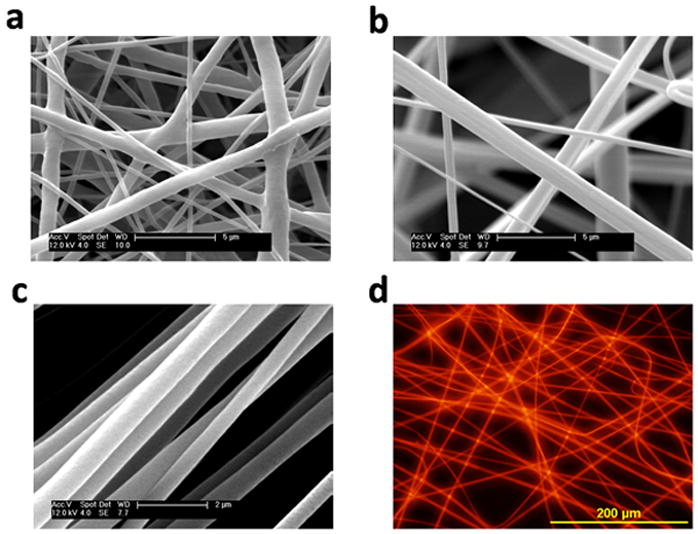
SEM images of fibers containing the Ru probe (a) PCL (b) PES (c) PCL aligned and (d) the fluorescence emitted by random PES fibers in oxygen-free conditions
3.2. Oxygen sensing in gaseous environments
The dynamic spectral response of these PCL and PES fibers to gaseous oxygen is shown in Figures 2(a) and (b). The saturated peak visible at 470 nm originates from the excitation light source. Ruthenium probe incorporated in the polymer fibers was efficiently excited by the excitation light and emitted the observed red fluorescence (Figure 1d) wavelengths. The emission peak of the Ru probe dissolved in ethanol is located at 613 nm; when the fluorescent behavior of the probe was evaluated in these polymer matrices we observed shifts in the emission peak. PCL as a matrix resulted in an emission peak at 626 nm; the PES matrix, 604 nm. The illumination-triggered fluorescence of the ruthenium probe is attributed to a metal-to-ligand charge transfer (MLCT) process in which an electron from a metal d orbital is promoted to a ligand π* orbital.[22] The associated emission peak is gradually quenched as the oxygen concentration increases from 0 to 100%. The ruthenium compounds have a relatively long triplet state lifetime and display sufficient triplet-triplet energy transfer to oxygen molecules diffusing through the polymer matrix. The decreased emission intensity versus increased oxygen concentration is caused by the growing number of oxygen molecules available for energy transfer/quenching.[23] Based on Figure 2, the total degree of quenching observed during the transition from pure nitrogen to pure oxygen (I0/I100) for PCL fibers is slighter larger than that of the PES fibers. This quenching response (I0/I100) is closely related to the gas permeability of the polymer matrix. The quenched percentage obtained here is less than those of highly gas permeable polymer such as silicones and some fluoropolymers.[24] However, the selected PCL matrix has comparable oxygen permeability with the commonly used polystyrene matrix but greater bio-affinity in both in vitro and in vivo applications.[25]
Figure 2.
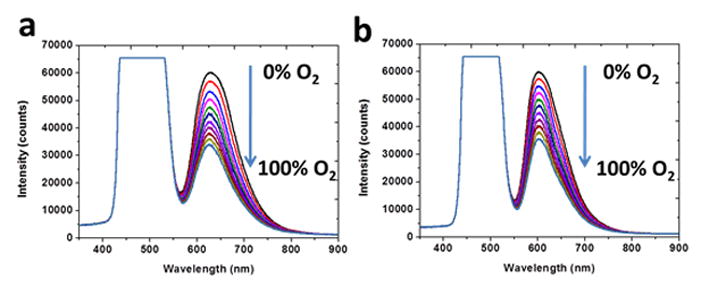
Response of (a) PCL fiber (b) PES fiber following exposure to the indicated oxygen contents (0–100% O2).
The quenching responses of PCL and PES sensors were further tested over a range of oxygen concentrations. The relative intensity change as function of oxygen concentration follows the Stern-Volmer equation [6]:
| [Equation 1] |
where I0 and I are the measured intensity in the absence of oxygen and presence of different oxygen concentrations, KSV is the Stern–Volmer quenching constant and [O2] the oxygen concentration. The Stern-Volmer plot for PCL fibers in various gaseous oxygen concentrations (Figure 3) yields a fitting coefficient R2 = 0.9966. Excellent linearity helps avoid the use of more complex modified Stern-Volmer equations and enables easy calibration. Interestingly, after the probe-containing PCL fibers were heated to 50°C for 12 hours, both the sensitivity and linearity noticeably were improved (Figure 3). The I0/I value at 100% oxygen concentration for the sintered PCL fibers increased by 19.9% and R2 increased to 0.9992. This change in sensing efficiency is attributed to an increase in the degree of crystallinity for this relatively low-melting polymer following this exposure. As a larger fraction of the polymer chains assume a more regular, closely packed structure, any embedded Ru probe molecules would see this more uniform structure/site. Alternatively, the elevated temperature exposure could increase crystallization to reject probe molecules into the surrounding amorphous phase. This could both decrease what little multi-site occupancy exists and improve sensitivity by concentrating the probe molecules in the amorphous regions more easily permeated by oxygen. The excellent linearity of the Stern-Volmer plot for the fiber-based sensors facilitates accurate calibration of the sensors prior to application in cell culture. A downward slope in the Stern-Volmer plot at high O2 levels (absent in our plots) is often attributed to the different quenching behavior of the luminophores on different sites.[26]
Figure 3.
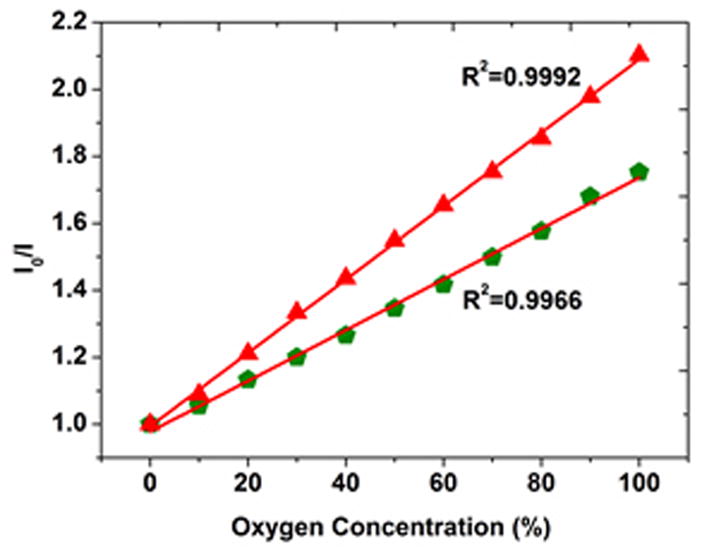
Stern–Volmer plots in gaseous oxygen for PCL fibers alone before (
 ) and after (
 ) 50°C heat treatment.
3.3. Response time
Response time is determined based on reversibility. The intensity of the emission peak for each sensor was continuously monitored and plotted in Figure 4 for (a) PCL and (b) PES as the environment alternated from 0 to 100% O2. No hysteresis was observed during these oxygen/nitrogen cycles in the gaseous state. Both the response and recovery times are defined as time required for a 95% change in intensity.[27] This t95 time is 0.9±0.12 s (mean ± standard deviation) for PCL fibers and 2.17±0.28 s for PES following the switch from 100% N2 to 100% O2. These values compare favorably to those observed using Cu- or Eu-based flurophores that had 4–10 times greater response times [3 paper refs]. Conversely, the recovery time from oxygen to nitrogen is 1.98±0.37 s and 2.43±0.18 s, respectively, likely reflecting the greater permeability of the polymer matrix for O2. These response and recovery time measurements also include the time required to exchange gases with the surrounding environment. Again, the net changes in peak intensities incurred during the transition from N2 to O2 are similar for PCL and PES. For comparison’s sake, we also fabricated and measured the response of Ru probe-containing PCL matrix films to oxygen conditions. Matrix film reversibility is markedly different. We observed that t95 for this film was at least two orders of magnitude greater than that of the electrospun fiber matrices. The effective area of a dense film for oxygen to diffuse into is equivalent only to the net surface area of the film. In contrast, the specific surface area of electrospun nanofibers is orders of the magnitude larger than their 2D film counterparts. The small diameter and porous nature of the electrospun fibers tends to provide a faster response time compared to 2D film sensors. Diffusion limitations preventing easy access to the probe are significantly minimized as the necessary depth of penetration of oxygen into the matrix is greatly reduced. Fast response times are critical to real-time monitoring of oxygen concentrations in targeted biological applications.
Figure 4.
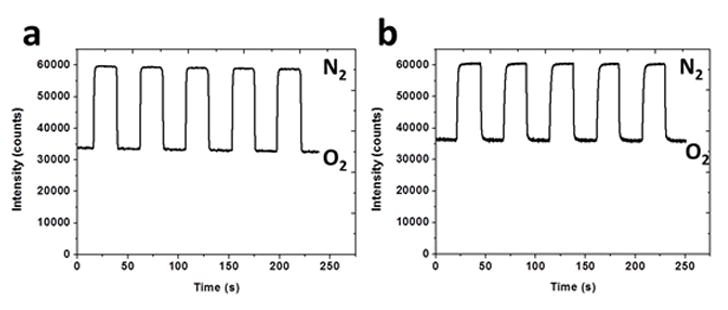
The response of (a) PCL fiber (b) PES fiber to cyclic exposure to O2 and N2.
3.4. Response to changes in dissolved oxygen
Fiber response to changes in dissolved oxygen in aqueous solution was tested by altering the aqueous environment of the samples between nitrogen-saturated and oxygen-saturated water. To attain complete saturation, ~30 minutes of continuous bubbling of each gas in the chamber was used to ensure equilibrium prior to measurement. For each sample, the fluorescence images were taken each time the aqueous condition was changed (in either the oxygenated or deoxygenated conditions) and the measured image intensity normalized relative to the initial intensity. Similar to the gaseous environments, the fluorescence intensity of Ru probe in the fibers decreased as the nitrogen-saturated solution was flushed with oxygen. All samples showed good reversibility as the intensity of the sample repeatedly changed from the initial value to a specific quenched value dependent upon on polymer identity when switching between deoxygenated and oxygenated water. About 44% of the intensity is quenched for PCL sample after full equilibrium with the bubbled oxygen was reached; for PES this value is much smaller, around 18% (Figure 5a).
Figure 5.
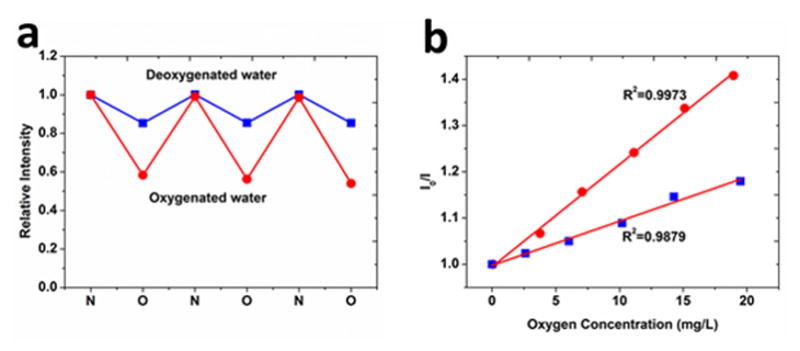
(a) Reversibility of the PES (
 ) and PCL (
 ) fibers in oxygen or nitrogen saturated water (b) Stern–Volmer plots derived from dissolved oxygen exposure of the PES (
 ) and PCL (
 ) fibers.
Both PCL and PES sensors display a good linear fit to the Stern-Volmer equation (Figure 5b) over the full range of the experiment (0–20 mg/L) with fitting coefficients (R2) of 0.9973 and 0.9879, respectively. The Stern–Volmer constant calculated from the fitted plot is 2.2×10⁻² (mg/L)−1 for PCL and 1.1×10⁻² (mg/L)−1 for PES fibers. The excellent linear fit of the data facilitates the accurate calibration of the sensor to real dissolved oxygen contents. The linear relationship covers the entire range of oxygen concentrations expected in cell culture (0–9.1 ppm).[28] The good linearity of the Stern-Volmer plot indicates that the quenching compound, oxygen in this case, is readily and equally available to luminophores embedded in the matrix.[28] Electrospun sensors produce a clearly linear dependence due to their small diameters and lack of multiple luminophore sites. SEM images reveal these small diameters and the porous nature of the overall assembly allowing easy diffusive access. Therefore oxygen molecules, in either the gaseous state or dissolved in aqueous solution, can freely diffuse into the electrospun mats and reach the embedded luminophores by penetrating the polymer fiber through radii of only 260–360 nm. The pathway lengths allowing access in these fibers are relatively short compared to conventional film sensors. The easy accessibility of oxygen to the probe molecules results in quick responses as well as excellent Stern-Volmer linearity.
In addition to easy accessibility, this linear relationship also provides proof of uniform probe distribution within the polymer matrix. Heterogeneity involving three different scales is thought to be the main contributor to non-linear Stern-Volmer plots [29]: a) macroheterogeneity due to unsatisfactory fabrication b) microheterogeneity due to either matrix crystallization, cracking or phase separation of the polymer and c) nanoheterogeneity due to molecular scale orientation or structure differences that could alter local oxygen diffusion. Under electrospinning fabrication conditions such heterogeneities are clearly absent. Before electrospinning, Ru probe molecules are uniformly dispersed in polymer/solvent solution. Luminophores in liquid solvents are exposed to identical environments on average time scales and exhibit linear Stern-Volmer plots.[30] During electrospinning, a high electrostatic voltage is applied to the precursor solution. The high repulsive force within the charged solution stretches the solution to form a jet and the solvent rapidly evaporates before the jet deposits on the grounded metal collector.[31] This process happens over such a short time scale that polymer chain rearrangement is restricted and probe molecules are likely “frozen” into place within the polymer matrix. Therefore, we could assume the uniformity of the environment surrounding the probe molecules in the resulting fibers is similar to that in the liquid especially when compared to literature reports of multi-site occupancy in thin polymer film matrices.[32]
3.5. Effects of fiber diameter
The diameters of the oxygen sensitive fibers were measured from the SEM images. The diameters of 50 randomly selected fibers were measured for each polymer matrix. HFP-spun PCL fibers averaged 0.53±0.32 μm; PES 0.72±0.43 μm. To investigate the effects of fiber diameters on sensing performance, a PCL/Ru probe solution was fabricated using dichloromethane (DCM)[33] instead of HFP while maintaining the same PCL/Ru ratio and electrospun under the same conditions. DCM as an electrospinning solution produces PCL fibers with much larger diameters (7.01±1.37 μm) and pore sizes allowing easy cell infiltration.[34] The oxygen sensitivity of Ru-containing DCM fibers was tested using the same atmospheric oxygen/nitrogen mixtures as before to determine quenching behavior and response time. The total magnitude of the quenched emission peak for DCM fibers cycled from N2 to O2 (I0/I100) is 4.0±1.7% smaller than that of the smaller diameter HFP fibers. The response time and recovery times for these DCM fibers are 1.79±0.23 s and 2.29±0.13 s, respectively. These values are 0.89 s and 0.31 s slower, respectively, than those of the smaller diameter HFP-fabricated fibers. An order of magnitude increase in PCL fiber diameter evidently reduces the sensitivity and increases the necessary response time; conversely, decreases in fiber diameter to less than 0.5 μm would likely decrease response times even further if needed. An increase in diameter imposes easily detected limits on oxygen diffusion through the polymer matrix. Therefore, smaller electrospun fiber diameters are clearly preferable in applications where rapid oxygen-sensing performance is desired.
3.6. PES-PCL core shell fiber
A core-shell configuration of the electrospun oxygen-sensitive fibers was explored with the probe containing PES serving as the ‘core’ and pure (i.e., not probe-containing) PCL acting as the ‘shell.’ Similar structure was created (e. g., in a spherical format) in other works to either reduce probe molecule photobleaching or to add other functions to the sensors.[35, 36] The core-shell fiber being investigated improves sensor performance in several respects: (1) the PES provides greater mechanical support for the sensor; (2) the PES core better protects the probe from photobleaching; (3) the PCL shell improves biocompatibility versus PES alone; (4) the addition of a probe-free shell structure could potentially slow probe leaching within the polymer matrix. The morphology typical of electrospun fiber is retained and the core-shell fibers have diameters of 0.96 ± 0.32 μm. To prove that the desired core-shell structure was achieved, a bright field microscope image and a corresponding red fluorescence image were obtained and merged (Figure 6a). The green portion of the image of the fibers represents the autofluorescence of the PCL shell under brightfield illumination and the orange region represents the probe embedded in the PES core. The core-shell structure shows defined boundaries between the fluorescent core and the PCL shell. In terms of sensing performance – as shown in Figure 6(b) – the fiber exhibits good fluorescence intensity reversibility when cycled between N2 and O2 gas. However, the response time is slightly reduced (by ~15% from 2.17±0.28 s to 2.91± 0.33 s) compared to PES fibers alone possibly due to the presence of a polymer-polymer interface. Although the core-shell fibers provide relatively low sensitivity, this technique could potentially be applied to sensor production involving any two polymers that can be electrospun to ideally combine the preferred properties of each polymer to both biologically and mechanically tailor overall sensor behavior.
Figure 6.
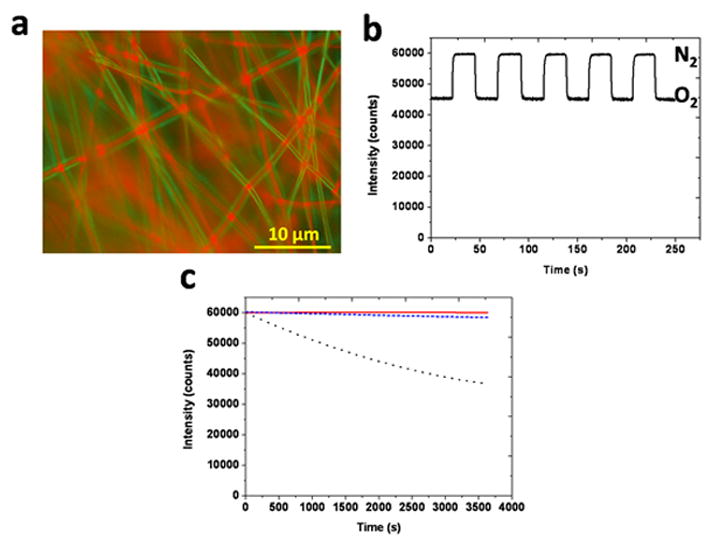
PES-PCL core-shell fibers as characterized by (a) wide-field, merged fluorescent images, (b) response to cyclic N2-O2 gas exposures and comparison of various fibers in terms of (c) photobleaching [PES (
 ), PCL (• • •) and PES-PCL core-shell (
 )].
)].
Oxygen sensors in different forms have been found applications in cell culture devices or even inside cells. Sinkala et al. developed oxygen sensitive microwells by embossing polystyrene and platinum(II) octaethylporphyrin ketone thin films and used this system to monitor oxygen tensions around kidney cells.[37] Work conducted by Wang and coworkers recently fabricated biocompatible fluorescent nanoparticles capable of reporting oxygen ratiometrically and applied the nanoparticles inside living human hepatocellular liver carcinoma (HepG2) cells.[38] Compared to such sensors, nanofiber based oxygen sensors are promising for their excellent biocompatibility and the possibility that they can be easily integrated into standard cell or tissue culture device. Electrospun fibers have a wide range of applications in tissue engineering for their controllable nano-scaled dimensions and features.[39] Core-shell structure platform could maintain the biological advantages of the shell while including other functional ingredient inside the core. We have previously been successfully producing aligned electrospun fiber based cell culture plates for the study of tumor cell migration.[15] If these fibers could be rendered oxygen sensitive, this model could potentially measure local oxygen gradients while cells are migrating.
3.7. Photobleaching
An underreported problem in this area is photobleaching, or the photochemical destruction of a fluorophore by the same light exposure needed to stimulate fluorescence. Under continuous excitation using the blue LED, the intensity of the emission peak for each sensor was monitored to examine photostability. During 3600s of intensive illumination, PCL fibers exhibit obvious signal decay (Figure 6c). However, for PES fibers no noticeable photobleaching is observed throughout the duration of the test. PES is a heat-resistant, transparent, tough and rigid polymer with higher glass transition temperature that likely better limits the migration and aggregation of probe molecules. The high thermal and chemical stability make PES a better matrix material for sensors having steady output and resistance to harsh conditions. A similar polymer, polysulfone, has been shown to function as an appropriate matrix polymer that could withstand autoclaving at 135°C for 60 min without any major changes in sensing abilities.[40] The 3600 s exposure tests in our work show that PES efficiently protects the embedded Ru probe and avoids significant photobleaching. Similarly, PES-PCL core-shell fibers show satisfactory photostability and only slight intensity losses during the same 3600 s exposure (Figure 6c).
3.8. Oxygen-sensing nanofiber cytotoxicity
To investigate cytotoxicity potentially caused by the presence of the Ru probes within these nanofiber sensors, both electrospun PCL without any probe molecules and the Ru probe-containing PCL nanofiber sensors were investigated using adherent cultures of glioblastoma cells. In Figure 7a, the observed cell morphologies and association of the cells on the different types of fibers are essentially identical. As shown in Figure 7b, cell attachment (cells/mm2) and viability (% dead/total cells) on Ru probe-containing nanofibers are not statistically different from probe-free PCL nanofibers, indicating that the fluorophore did not cause any significant toxicity on cultured cells
Figure 7.
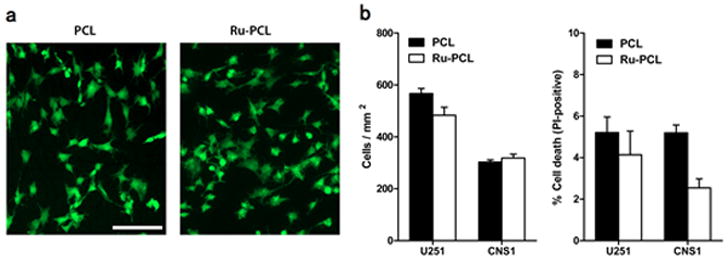
(a) Representative images of CNS1 glioblastoma cells cultured on polycaprolactone (PCL) or Ru probe containing PCL (Ru-PCL) nanofiber scaffolds (bar = 100 μm) (b) Cell density (cells/mm2) and percentage of dead cells were quantified for two different glioblastoma cell lines cultured on nanofiber scaffolds for 48h.
4. Conclusions
In this study, we have demonstrated that these nanofiber-based sensor systems can achieve a highly linear range of net fluorescence emission versus oxygen content. The apparently small number of sites upon which the probe sits in this system relative to film-based systems allows for minimal deviations from Stern-Volmer linearity that contrasts sharply with film-based polymer carriers. Further improvements in accuracy/linearity can apparently be achieved by thermal exposure. Larger fiber diameters provide enough of a diffusion barrier to decrease sensitivity while having relatively little effect on recovery time likely due to the more limited interactions of N2 with the polymer matrix. Comparing PES to PCL shows that composition has stronger effects on both response and recovery time than PCL diameter. PES more efficiently protects the probe from photobleaching. The combination of a PCL shell with a PES core allows utilization of PES’s advantages in protecting the probe while providing a more biocompatible surface. The use of electrospun core-shell fibers as oxygen sensors has practical advantages over monolithic fibers while both exhibit substantial advantages over thin films. Finally, even the non-core shell compositions containing the Ru oxygen probe result in no apparent cytotoxicity in adherent glioblastoma cell populations. Future work will focus on other polymer and probe combinations to improve the sensitivity and the use of cell culture plates with built-in nanofiber sensors that monitor local oxygen contents.
Supplementary Material
Acknowledgments
The project described was supported by Grant Number 1033991 from the National Science Foundation Chemical, Bioengineering, Environmental, and Transport Systems Division. The content is solely the responsibility of the authors and does not necessarily represent the official views of the National Science Foundation. R.X. and J.J.L are both full-time employees of the Ohio State University. The authors thank Professor Patricia Morris for the use of her fluorescence microscope in this work.
Abbreviations
- PCL
polycaprolactone
- PES
polyethersulfone
- [Ru(dpp)3]2+
tris (4,7-diphenyl-1,10-phenanthroline) ruthenium(II)
- HFP
1,1,1,3,3,3-hexafluoro-2-propanol
- DCM
dichloromethane
- SEM
scanning electron microscopy
- ECM
extracellular matrix
References
- 1.Xu H, Aylott JW, Kopelman R, Miller TJ, Philbert MA. Anal Chem. 2001;73:4124–4133. doi: 10.1021/ac0102718. [DOI] [PubMed] [Google Scholar]
- 2.Csete M. Ann N Y Acad Sci. 2005;1049:1–8. doi: 10.1196/annals.1334.001. [DOI] [PubMed] [Google Scholar]
- 3.Curcio E, Macchiarini P, De Bartolo L. Biomaterials. 2010;31:5131–5136. doi: 10.1016/j.biomaterials.2010.03.013. [DOI] [PubMed] [Google Scholar]
- 4.Grist SM, Chrostowski L, Cheung KC. Sensors. 2010;10:9286–9316. doi: 10.3390/s101009286. [DOI] [PMC free article] [PubMed] [Google Scholar]
- 5.Wang X, Chen H, Zhao Y, Chen X, Wang XTrAC. Trends Anal Chem. 2010;29:319–338. [Google Scholar]
- 6.Amao Y. Microchim Acta. 2003;143:1–12. [Google Scholar]
- 7.Wang XD, Gorris HH, Stolwijk JA, Meier RJ, Groegel DBM, Wegener J, Wolfbeis OS. Chemical Science. 2011;2:901–906. [Google Scholar]
- 8.Klimant I, Kuhl M, Glud RN, Holst G. Sensors and Actuators B-Chemical. 1997;38:29–37. [Google Scholar]
- 9.Koo YEL, Cao YF, Kopelman R, Koo SM, Brasuel M, Philbert MA. Anal Chem. 2004;76:2498–2505. doi: 10.1021/ac035493f. [DOI] [PubMed] [Google Scholar]
- 10.Zaharieva J, Milanova M, Todorovsky D. Journal of Materials Chemistry. 2011;21:4893–4903. [Google Scholar]
- 11.Mongey K, Vos JG, Maccraith BD, Mcdonagh CM. J Sol-Gel Sci Technol. 1997;8:979–983. [Google Scholar]
- 12.Hartmann P, Ziegler W, Holst G, Lubbers DW. Sensors and Actuators B-Chemical. 1997;38:110–115. [Google Scholar]
- 13.Thomas PC, Halter M, Tona A, Raghavan SR, Plant AL, Forry SP. Anal Chem. 2009;81:9239–9246. doi: 10.1021/ac9013379. [DOI] [PubMed] [Google Scholar]
- 14.Basri H, Ismail AF, Aziz M, Nagai K, Matsuura T, Abdullah MS, Ng BC. Desalination. 2010;261:264–271. [Google Scholar]
- 15.Johnson J, Nowicki MO, Lee CH, Chiocca EA, Viapiano MS, Lawler SE, Lannutti JJ. Tissue Engineering Part C-Methods. 2009;15:531–540. doi: 10.1089/ten.tec.2008.0486. [DOI] [PMC free article] [PubMed] [Google Scholar]
- 16.Lannutti J, Reneker D, Ma T, Tomasko D, Farson D. Materials Science and Engineering C. 2007;27:504–509. [Google Scholar]
- 17.Agudelo-Garcia PA, De Jesus JK, Williams SP, Nowicki MO, Chiocca EA, Liyanarachchi S, Li PK, Lannutti JJ, Johnson JK, Lawler SE, Viapiano MS. Neoplasia. 2011;13:831–U896. doi: 10.1593/neo.11612. [DOI] [PMC free article] [PubMed] [Google Scholar]
- 18.Lee CH, Lim YC, Farson DF, Powell HM, Lannutti JJ. Ann Biomed Eng. 2011;39:3031–3041. doi: 10.1007/s10439-011-0417-z. [DOI] [PubMed] [Google Scholar]
- 19.Johnson J, Ghosh A, Lannutti J. J Appl Polym Sci. 2007;104:2919–2927. [Google Scholar]
- 20.Nam J, Huang Y, Agarwal S, Lannutti J. J Appl Polym Sci. 2008;107:1547–1554. [Google Scholar]
- 21.Gaumer J, Prasad A, Lee D, Lannutti J. Acta Biomater. 2009;5:1552–1561. doi: 10.1016/j.actbio.2009.01.021. [DOI] [PubMed] [Google Scholar]
- 22.Guo L, Ni Q, Li J, Zhang L, Lin X, Xie Z, Chen G. Talanta. 2008;74:1032–1037. doi: 10.1016/j.talanta.2007.08.014. [DOI] [PubMed] [Google Scholar]
- 23.Lee SK, Okura I. Spectrochimica Acta Part a-Molecular and Biomolecular Spectroscopy. 1998;54:91–100. [Google Scholar]
- 24.Klimant I, Wolfbeis OS. Anal Chem. 1995;67:3160–3166. [Google Scholar]
- 25.Olabarrieta I, Forsström D, Gedde UW, Hedenqvist MS. Polymer. 2001;42:4401–4408. [Google Scholar]
- 26.Xu W, McDonough RC, Langsdorf B, Demas JN, DeGraff BA. Anal Chem. 1994;66:4133–4141. doi: 10.1021/ac00095a004. [DOI] [PubMed] [Google Scholar]
- 27.Tian YQ, Shumway BR, Gao WM, Youngbull C, Holl MR, Johnson RH, Meldrum DR. Sensors and Actuators B-Chemical. 2010;150:579–587. doi: 10.1016/j.snb.2010.08.036. [DOI] [PMC free article] [PubMed] [Google Scholar]
- 28.O’Neal DP, Meledeo MA, Davis JR, Ibey BL, Gant VA, Pishko MV, Cote GL. Ieee Sensors Journal. 2004;4:728–734. [Google Scholar]
- 29.DeGraff BA, Demas JN. In: Luminescence-Based Oxygen Sensors Reviews in Fluorescence 2005. Geddes CD, Lakowicz JR, editors. Springer; US: 2005. pp. 125–151. [Google Scholar]
- 30.Hartmann P, Leiner MJP, Lippitsch ME. Sensors and Actuators B: Chemical. 1995;29:251–257. [Google Scholar]
- 31.Sill TJ, von Recum HA. Biomaterials. 2008;29:1989–2006. doi: 10.1016/j.biomaterials.2008.01.011. [DOI] [PubMed] [Google Scholar]
- 32.Kneas KA, Demas JN, DeGraff BA, Periasamy A. Microscopy and Microanalysis. 2000;6:551–562. [PubMed] [Google Scholar]
- 33.Nam J, Rath B, Knobloch TJ, Lannutti JJ, Agarwal S. Tissue Eng Pt A. 2009;15:513–523. doi: 10.1089/ten.tea.2007.0353. [DOI] [PMC free article] [PubMed] [Google Scholar]
- 34.Nam J, Johnson J, Lannutti JJ, Agarwal S. Acta Biomater. 2011;7:1516–1524. doi: 10.1016/j.actbio.2010.11.022. [DOI] [PMC free article] [PubMed] [Google Scholar]
- 35.Chu C, Lo Y. Sensors and Actuators B-Chemical. 2010;151:83–89. [Google Scholar]
- 36.Liu L, Li B, Qin R, Zhao H, Ren X, Su Z. Nanotechnology. 2010;21:285701. doi: 10.1088/0957-4484/21/28/285701. [DOI] [PubMed] [Google Scholar]
- 37.Sinkala E, Eddington DT. Lab Chip. 2010;10:3291–3295. doi: 10.1039/c0lc00244e. [DOI] [PubMed] [Google Scholar]
- 38.Wang X, Peng H, Ding H, You F, Huang S, Teng F, Dong B, Song H. Journal of Materials Chemistry. 2012;22:16066–16071. [Google Scholar]
- 39.Zhang LF, Hsieh YL. Nanotechnology. 2006;17:4416–4423. [Google Scholar]
- 40.Voraberger HS, Kreimaier H, Biebernik K, Kern W. Sensors and Actuators B: Chemical. 2001;74:179–185. [Google Scholar]
Associated Data
This section collects any data citations, data availability statements, or supplementary materials included in this article.


