
Figure 3.
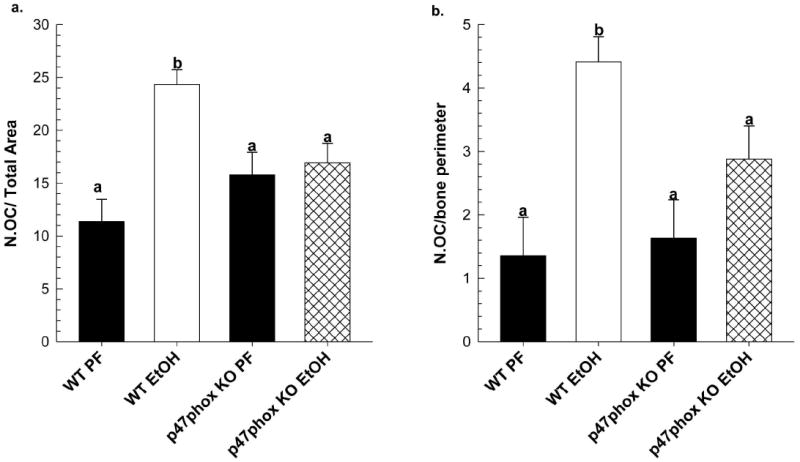
Quantitative histomorphometry analysis of TRAP-stained osteoclasts; (a) osteoclast number (N.OC) per total area, and (b) N.OC per bone perimeter in undecalcified MMA-embedded tibias from WT and p47phox KO EtOH (n=6/group) and PF controls (n=3/group) as described in Materials and Methods. Data are expressed as mean ± SEM. Statistical significance was determined by Two-way ANOVA followed by Student-Newman Keuls post hoc analysis. Groups with different letters are significantly different from each other (p<0.05).