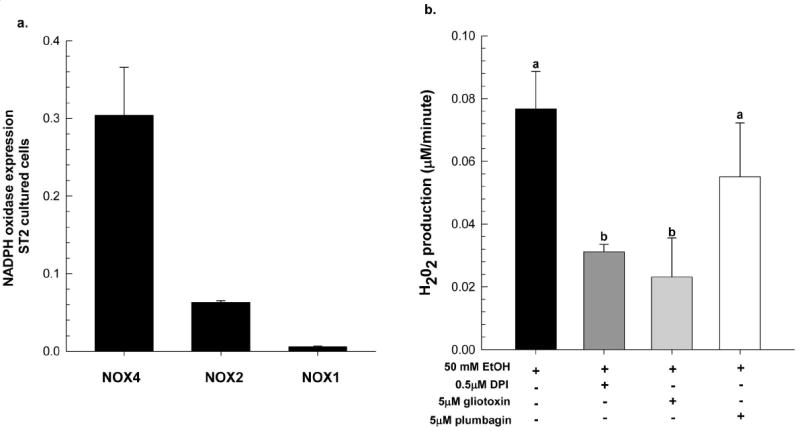
Figure 5.

Gene expression of (a) NADPH oxidase enzymes in cultured ST2 cells as measured by real-time PCR, normalized to GAPDH mRNA; fold expression is reported as mean ± SEM. In a separate experiment, (b) ST2 cells were pre-incubated with different NADPH oxidase inhibitors for 30 minutes prior to EtOH-treatment (50 mM) for 1 hr at 37°C, at which H202 production was measured using the Amplex Red hydrogen peroxide/peroxidase assay kit as described in Materials and Methods. Data presented here are representative of two independent experiments performed in triplicate and expressed as the rate of H202 production per minute which were corrected for background absorbance by subtracting experimental values from those obtained in control wells; ST2 cells +/- inhibitor without EtOH treatment. Statistical significance was determined by One-way ANOVA followed by Student-Newman Keuls post hoc analysis, a<b, p<0.05.
