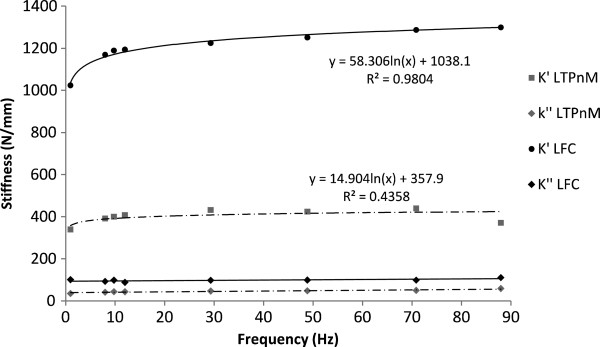
Figure 1.

Frequency dependency of storage (k’) and loss (k”) stiffness for two cartilage samples. The two samples shown were from the lateral tibial plateau, not under the meniscus (LTPnM), and lateral femoral condyle (LFC). The former was 2.1 mm and the latter 0.9 mm thick. A trend-line, of the form of equation 1, is included for the storage stiffness of both samples. Note, in the equations in the graph x refers to the frequency (f in equation 1) and y to the storage stiffness (k’ in equation 1).
