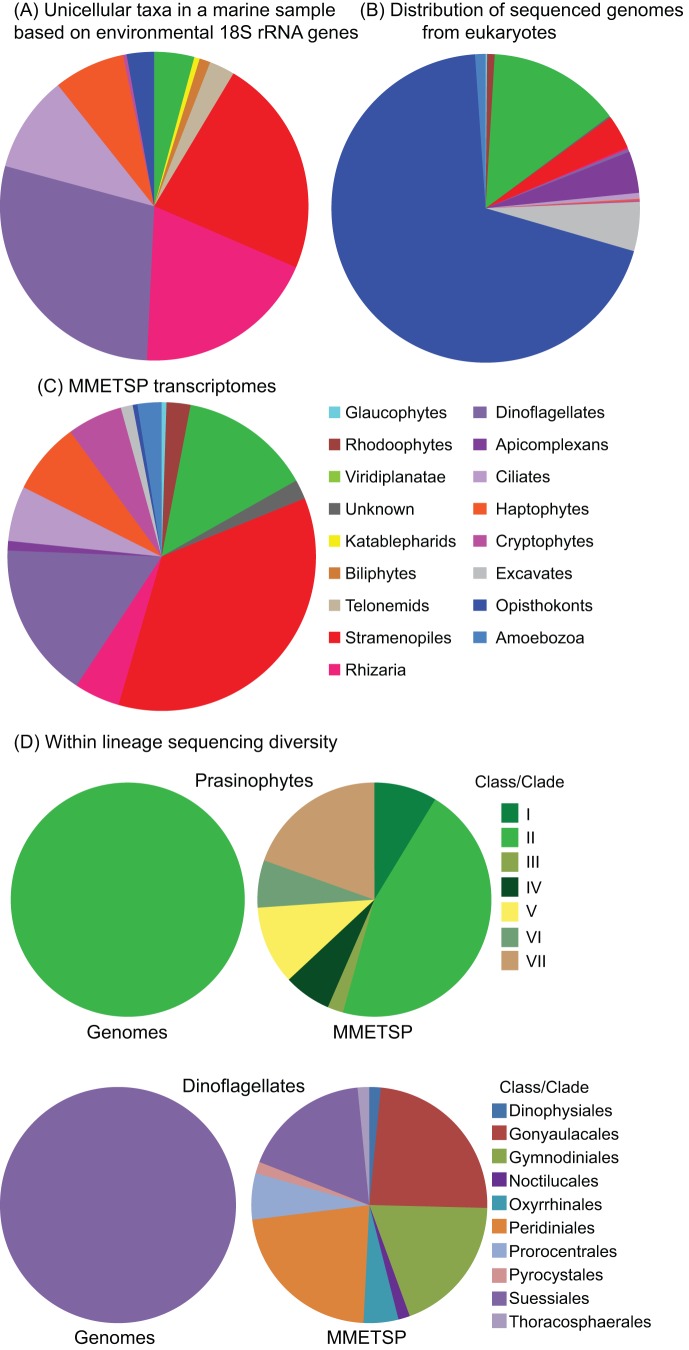
Figure 1. Comparing the diversity of microbial eukaryotes at one marine site with that represented in genome data and the MMETSP project.
(A) Taxon assignments for 930 Small Subunit (SSU) rRNA gene sequences from environmental clone libraries built using DNA from three size fractions in sunlit surface waters of the North Pacific Ocean. Four hundred and five sequences corresponding to Syndiniales (nonphotosynthetic members of the dinoflagellate lineage, often referred to as MALV1 and MALV2) were excluded for visualization purposes. Syndiniales are not represented in any complete genome data or the MMETSP, and the vast majority are only known as sequences from uncultivated taxa that often dominate clone libraries [22],[31]. Filter size fractions were 0.1 to <0.8 µm, 0.8 to <3 µm, and 3 to <20 µm. This graph is only intended to give a snapshot of one marine sample; relative distributions vary based on distance from shore and depth, and several studies provide more detailed reviews of available SSU rRNA gene sequence surveys, see e.g., [21],[32]. (B) Taxonomic diversity of eukaryotes with complete genome sequences, as summarized in the Genomes Online Database (GOLD: http://genomesonline.org). Note that multicellular organisms are included (unlike in A or C); animals, land plants, and multicellular rhodophytes are included in the opisthokont, viridiplantae, and rhodophyte categories, respectively. (C) Taxon breakdown of the MMETSP sequencing project, collapsed at the strain level (for some strains, cells were grown under multiple conditions and these have been counted only once). (D) Comparison of currently available complete genomes and MMETSP transcriptomes by Class for two diverse and well-studied groups of algae, prasinophytes [14] and dinoflagellates [15],[16]. For both lineages, genomes are broken down by Class on the left and MMETSP transcriptomes on the right.

