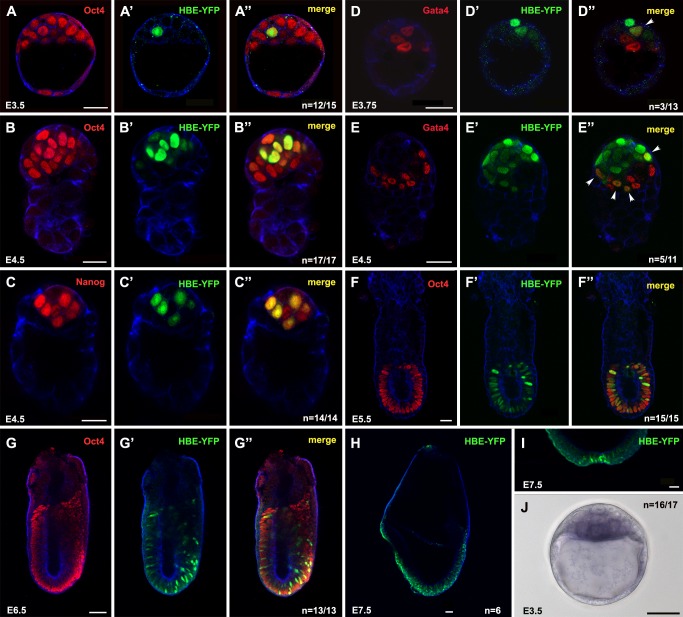
Figure 2. HBE-YFP expression is detected between E3.5 and E8.0.
(A–A″, B–B″, F–F″, G–G″) Detection of Oct4 and HBE-YFP in E3.5 (A–A′), E4.5 (B–B′), E5.5 (F–F′), or E6.5 (G–G′) HBE-YFP transgenic mouse embryos. (C–C″) Detection of Nanog (C) and HBE-YFP (C′) in an E4.5 HBE-YFP transgenic mouse embryo (C″). (D–E″) Detection of Gata4 (D and E) and HBE-YFP (D′ and E′) in E3.75 (D″) or E4.5 (E″) embryos. Arrowheads indicate co-expressing nuclei. (H–I) Expression of HBE-YFP in the epiblast (H) and the node (I) of an E7.5 embryo. Images A to I are single confocal sections. Cortical actin in blue. n is the number of representative embryos on the total number of HBE-YFP embryos analyzed. (J) In situ hybridization for YFP in an E3.5 HBE-YFP embryo. n is the number of stained embryos on the total number of HBE-YFP embryos analyzed. Scale bar, 25 µm (except in G, H, I, and J where scale bar, 50 µm).

