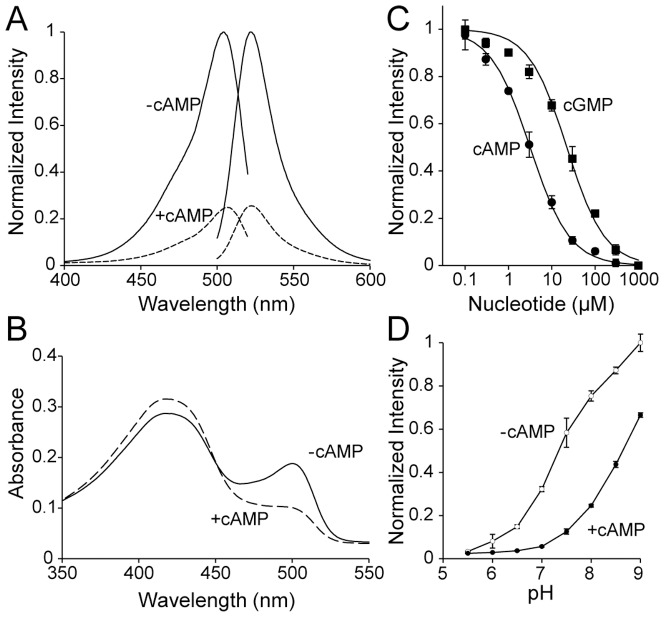
Figure 2. Spectral characterization of Flamindo2.
(A) Fluorescence spectra of Flamindo2 protein. Excitation and emission spectra were measured in the presence (dotted lines, +cAMP) or absence (solid lines, -cAMP) of 1 mM cAMP. Each fluorescence intensity (FI) was normalized to the peak of FI in the absence of cAMP. The representative excitation/emission spectra data from three independent experiments was shown in the graph. (B) Absorbance spectra of Flamindo2 protein in the presence (dotted line, +cAMP) or absence (solid line, -cAMP) of 1 mM cAMP. The representative absorption spectra data from three independent experiments was shown in the graph. (C) Titration curves of cAMP and cGMP. The peak of FI at each concentration of cAMP (closed circles) or cGMP (closed squares) was normalized to the peak of FI in the absence of cAMP or cGMP. The results are mean ± SD (n = 3) (D) Titration curves against pH. The peak of FI at each pH in the presence (closed circles) or absence (open circles) of 1 mM cAMP was normalized to the peak of FI at pH 9.0 in the absence of cAMP. The results are mean ± SD (n = 3).

