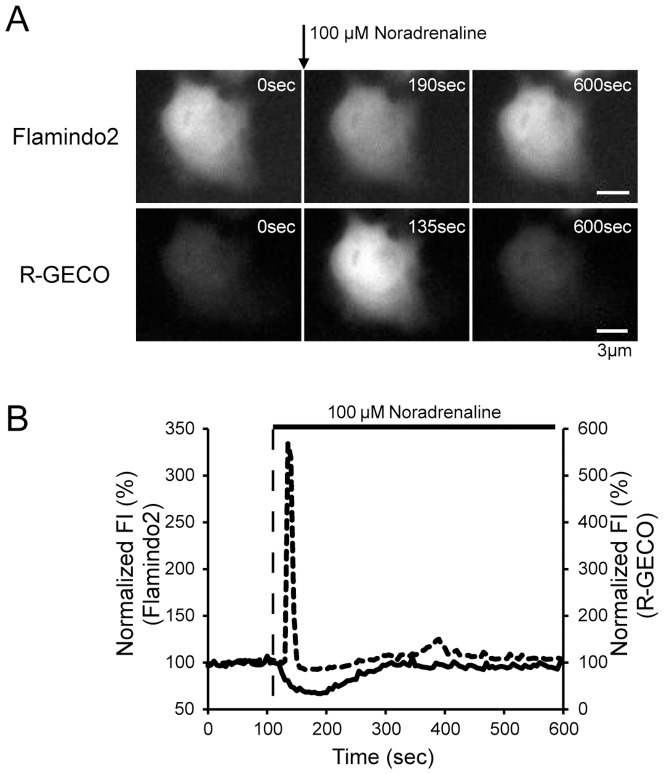
Figure 4. Dual-color imaging of cAMP and Ca2+ in Flamindo2 and R-GECO co-expressing HeLa cells.
(A) Images of changes in fluorescence of Flamindo2 and R-GECO induced by 100 µM noradrenaline. (B) Time course of changes in cAMP (solid line) and Ca2+ (dotted line) induced by 100 µM noradrenaline. Noradrenaline was applied at 120 s. Representative trace is shown in the graph.

