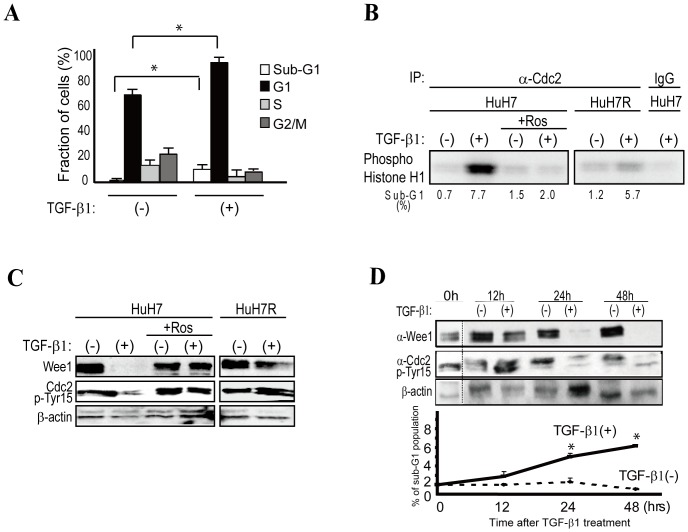
Figure 1. TGF-B1 induces apoptosis through cdc2 activation.
A, FACS analyses showed that the sub-G1 phase HuH7 cell population increased from approximately 0.7% to 7.7%, and cells in the G1 phase increased from approximately 69% to 87% 48 h after TGF-β1 treatment. Data represent the means ± S.D. of three experiments. * indicates significant differences between each group (P<0.05). B, Cdc2 kinase activity was determined based on the level of phosphorylated histone H1 using histone H1 as a substrate. Cdc2 was activated 48 h after TGF-β1 treatment in HuH7 cells. However, cdc2 was not activated in HuH7R cells, which were isolated as an apoptosis-resistant clone from TGF-β1-treated HuH7 cells. Roscovitine (Ros)-pretreated HuH7 cells did not show cdc2 activation. A representative image from three independent experiments is shown. C, After TGF-β1 treatment (48 h), we observed cdc2 Tyr15 dephosphorylation in association with Wee1 kinase down-regulation in apoptotic cells. Pretreatment with 20 µM roscovitine completely abolished apoptosis and restored Wee1 kinase expression. TGF-β1 treatment induced G1 cell cycle arrest in HuH7R cells; however, Wee1 kinase expression and non-phosphorylated cdc2 Tyr 15 were similar to those of roscovitine-pretreated HuH7 cells. A representative image of three experiments is shown. D, Wee1 down-regulation and cdc2 Tyr15 dephosphorylation commenced approximately 24 h after TGF-β1 treatment, which was similar to thea initiation of apoptosis. A representative Western blot image is shown in the upper panels. The results in the lower graphs represent the means ± S.D. of three experiments. * indicates significant differences between each group (P<0.05).

