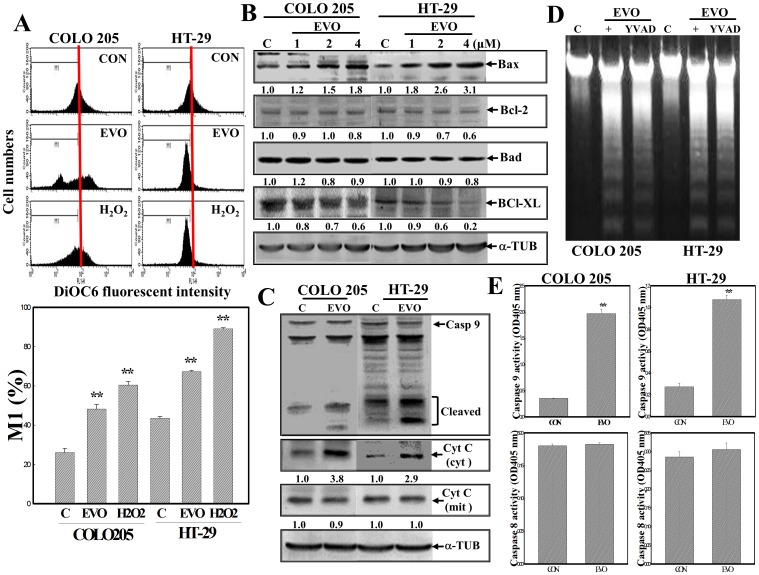
Figure 2. Disruption of the mitochondrial membrane potential (MMP) with increased Bax protein and cytosolic cytochrome (Cyt) c protein expressions, and caspase-9 (Casp 9) protein cleavage in EVO-treated COLO205 and HT-29 cells.
(A) Loss of the MMP by EVO and H2O2 in COLO205 and HT-29 cells. Cells were treated with EVO (2 µM) or H2O2 (100 µM) for 12 h, and the MMP was detected by a flow cytometric analysis using DiOC6 as a fluorescent dye. (upper) A representative example of flow cytometric data is shown; (lower) quantification of the M1 ratio from three independent experiments is shown. (B) Alternative Bcl-2 family protein expression by EVO was detected by Western blotting using specific antibodies. Cells were treated with different concentrations of EVO for 24 h, and expressions of indicated proteins were detected by Western blotting. (C) EVO induction of Casp 9 protein cleavage and cytosolic Cyt c protein in COLO205 and HT-29 cells. As described in (C), expressions of Casp 9, cytosolic Cyt C, and mitochondrial Cyt c proteins were examined by Western blotting using specific antibodies. (D) The peptidyl Casp 9 inhibitor, Ac-YVAD-FMK (YVAD; 100 µM), inhibited EVO-induced DNA ladder formation by COLO205 and HT-29 cells. Cells were incubated with Ac-YVAD-FMK (100 µM) for 2 h followed by EVO (2 µM) treatment for 24 h, and DNA integrity was examined by agarose electrophoresis. (E) A significant increase in Casp 9, but not Casp 8, enzyme activity in EVO-treated colorectal carcinoma cells. As described in (C), activities of Casp 9 and 8 were respectively measured by adding the Casp 9-specific colorimetric peptidyl substrate, Ac-DEVD-pNA, or the Casp 8-specific colorimetric peptidyl substrate, Ac-IETD-pNA. Each data point was calculated from three triplicate groups, and data are displayed as the mean ± S.D. ** p<0.01 denotes a significant difference compared to the control (C or CON) group. The intensity of each band was examined by a densitometric analysis (Imag J), and expressed as multiples of the control.

