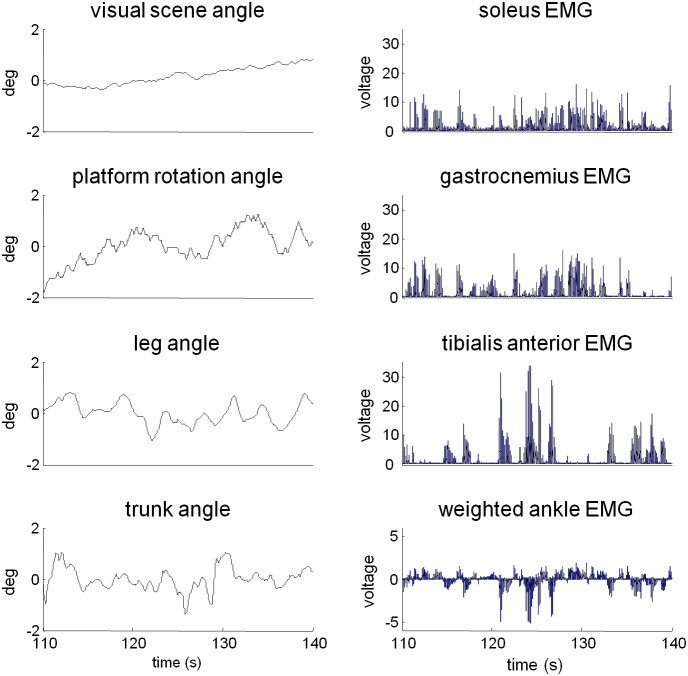
Figure 2. Perturbation, kinematics and ankle EMG of a single trial of a single subject in the high amplitude platform: low amplitude vision condition.
Mean values were subtracted from the visual scene, platform, trunk and leg angles. Individual EMGs were normalized by the root-mean-square value. The weighted ankle EMG for this subject had weights of.28 for the soleus,.23 for gastrocnemius, and -.48 for tibialis anterior. These weights maximized coherence to average of visual and platform signals (see methods).

