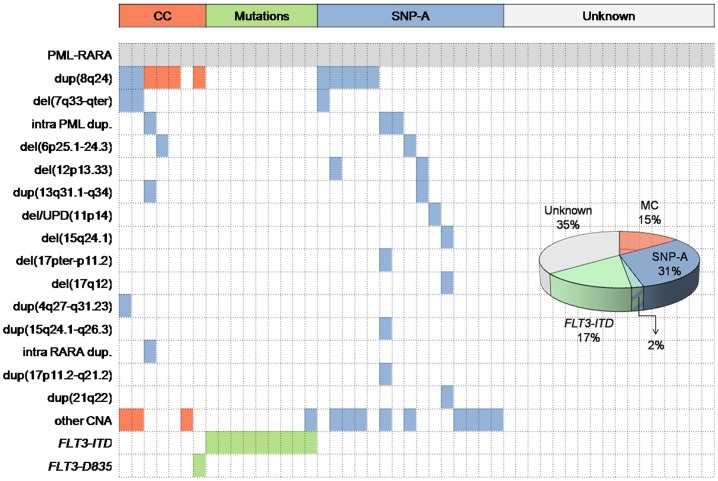
Figure 3. Heatmap and pie chart depicting abnormalities found in our series in addition to the t(15;17).
Each column represents one patient. Abnormalities are listed in the Y axis and coloured in the corresponding row of the heatmap. Abnormalities detected by Conventional Cytogenetics (CC) (red) and FLT3 mutations (green) are frequent events; however, SNP-A revealed an important proportion of patients with potentially leukemogeneic abnormalities (blue). Dup: duplication: del: deletion; CNA: copy-number abnormality.

