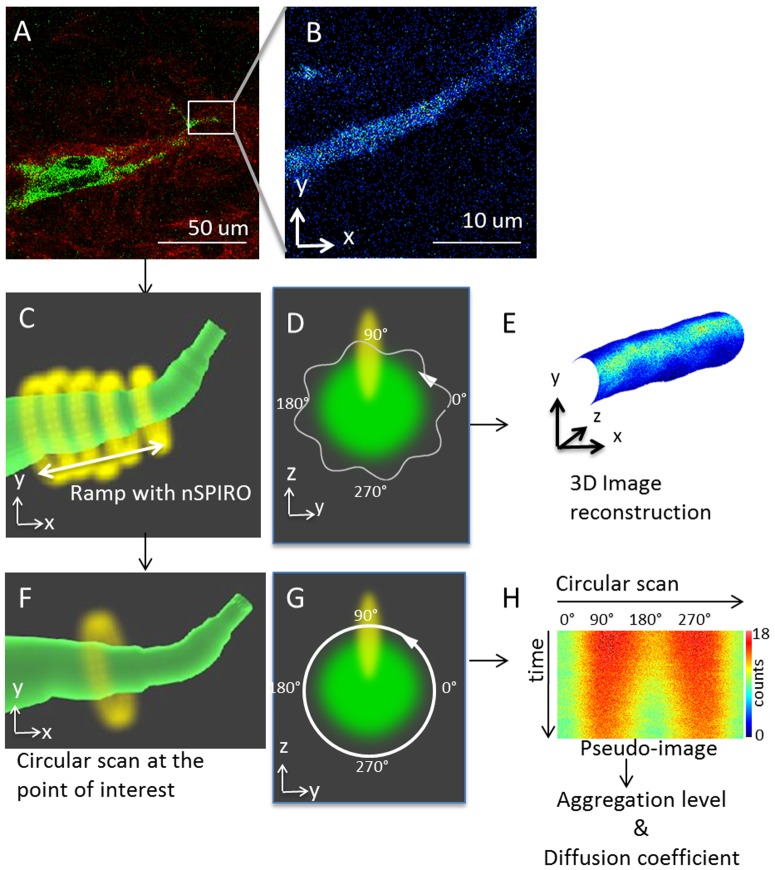
Figure 1. Experimental workflow.
(A) First, a raster scan image of an MDA-MB-231 cell with fluorescent expression (green) cultured in type I collagen (red) was taken. In this example, MDA-MB-231 cell was labeled with paxillin-GFP, and the image was taken with 2-photon microscope to detect simultaneously fluorescence and SHG from the collagen. (B) Once the location of cell protrusion was identified, we took zoomed to identify a cell protrusion. Here only the fluorescence image is shown. (C) After identifying the cell protrusion region of interest, we switched the scanning mode from raster scan to nSPIRO. This schematic graph shows the nSPIRO circular scan (yellow) ramps along the cell protrusion (green) identified from (B). The circular scan orbit size was selected according to the cell protrusion radius. While ramping along the cell protrusion, the center position of circular scan is maintained on the cell protrusion by nSPIRO feedback method, as described in Materials and Methods section. The intensity profiles of fluorescent proteins in cell protrusion as well as SHG of nearby collagen fibers aree recorded simultaneously. (D) A schematic graph showing the cross section of the protrusion shown in (C) in green, and the trajectory of circular orbit with amplitude modulation (white). The yellow oval shape represents the PSF. The PSF is elongated along z direction, resulting in higher intensity near 90° and 270° due to larger observation volume overlap with the fluorescent structure, and lower intensity near 0° and 180°. (E) After collecting the data from (C), the 3D image reconstruction can be done. The reconstruction utilizes circular scan location and radius to create cylindrical-shaped mesh covered with a texture which represents the intensity profile. (F) Schematic graph showing that the circular scan method can also be applied at a point of interest while the nSPIRO tracking routine maintains the orbit centers on the protrusion. This technique allows the measurement of protein dynamics at a specific orbit location with high temporal resolution. (G) A schematic graph showing the cross section of the protrusion shown in (C) in green, and the trajectory of circular orbit without amplitude modulation (white). The arrow indicates the orbit scan direction, and 0° represents the orbit starting point. The yellow oval shape represents the PSF. The amplitude modulation was not used to avoid introducing artifact for image correlation analysis. (H) Circular scans data from (F) were represented as a pseudo-image in which the horizontal dimension is pixel position along a circular scan, which corresponds to the position 0° to 360° in (G), and the vertical dimension is time. In the pseudo-image, the intensities around 90° and 270° were higher than at 0° and 180° due to the PSF shape, which is different in the x and z directions, as explained in (D). The color scale shows that this effect is not very large, accounting for about 20% variations along the orbit. The data were further analyzed to retrieve protein diffusion coefficients and aggregation level, as described in Materials and Methods.

