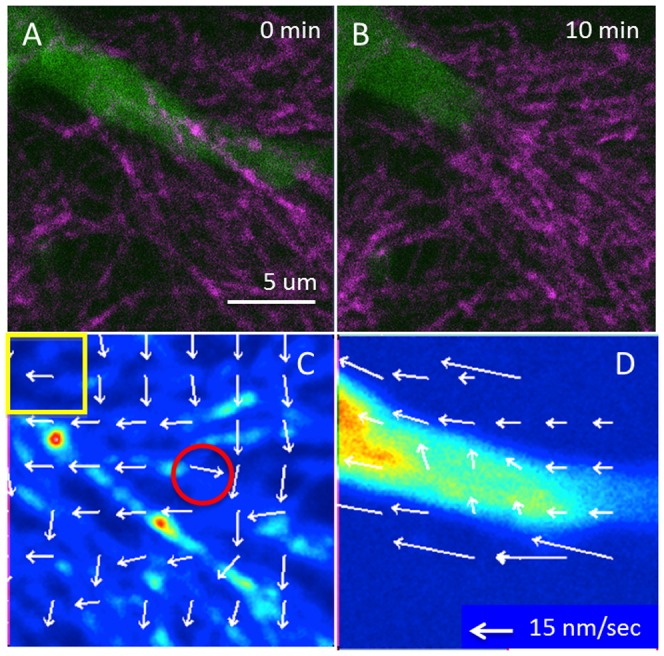
Figure 3. STICS analysis showing collagen fiber displacement.

(A and B) STICS analysis was applied to a 10 minutes time-lapse movie of collagen SHG signal (purple) and MDA-MB-231 cells with actin-EGFP expression (green) taken by the two-photon microscope to collect the SHG of collagen. (A) Shows the beginning and (B) shows the end of the time-lapse. (C and D) STICS was applied to 64×64 pixel regions on the entire 256×256 pixels image for both channels. (C) Shows STICS analysis on collagen. The yellow box shows the size of the sliding region used for analysis. Arrows indicate the speed and the direction of the average motion at each 32×32 pixel region. The red circle shows a region of collagen fiber that moved toward the opposite side of cell retraction, indicating possible detach and relaxation of collagen fiber from the cell. (D) Shows the SITCS analysis on the fluorescence signal form the cell protrusion, which has more uniform movement.
