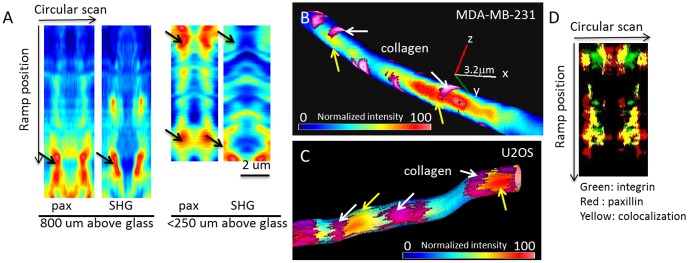
Figure 4. Paxillin localization detected by nSPIRO imaging.

(A) Paxillin-EGFP (pax) and collagen SHG intensity measured by nSPIRO along a cell protrusion as described in Figure 1C. Data were represented as pseudo-images, where the horizontal axis represents intensity along each circular scan and the vertical axis represents the ramp position along the cell protrusion. The non-uniform distribution of paxillin-EGFP was found at both cell protrusion embedded in collagen matrix (800 µm above glass) and closer to glass surface (<250 µm above glass). Furthermore, the position of high paxillin-EGFP intensity is adjacent to collagen fibers, as indicated by black arrows. (B) Nano-imaging of paxillin-EGFP expression on MDA-MB-231 cell protrusion is reconstructed as described in the introduction and Figure S1. Paxillin-EGFP intensity was color-coded and overlaid with collagen fibers (purple, indicated by white arrows) near the cell protrusion. Paxillin-EGFP shows high intensity spots (yellow arrows) on both sides of the collagen fiber, indicating the cell protrusion may ‘grab’ the collagen fiber. The axis represents 3.2 µm on x, y and z directions. (C) Nano-imaging of paxillin-EGFP expression on U2OS cell protrusion. Similar paxillin distribution as seen from MDA-MB-231 cells can be also seen in U2OS cells. (D) Integrin-EGFP (green) and paxillin-mCherry (red) showed high colocalization (yellow) at MDA-MB-231 cell protrusion, supporting the hypothesis that the paxillin high intensity sites are possible locations of focal adhesions, and the focal adhesions in 3D may be integrin-dependent.
