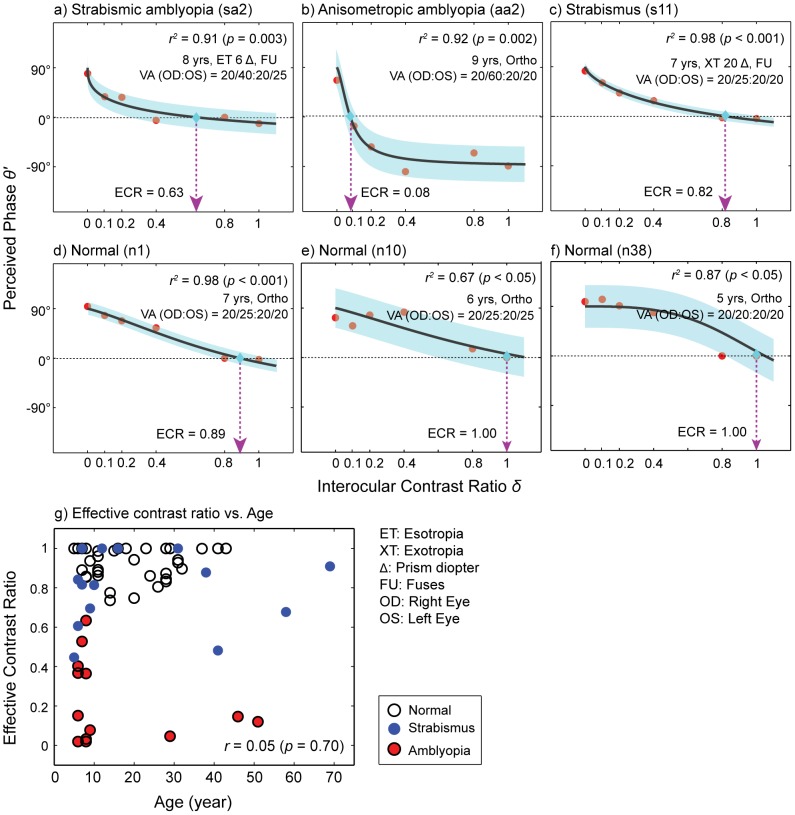
Figure 2. Examples of individual subject data.
Each panel contains the perceived phase versus interocular contrast ratio function (red circles) of a representative subject from each group. Subject's age, angular eye deviation (type and amount of deviation), fixational information (fuses, left or right eye) and visual acuity are also shown in each panel. The data were fitted with the attenuation model (Eq. 4) to estimate effective contrast ratio (ECR) of the weak eye. The black solid lines are the best fits of the model. The dotted arrow lines (magenta color) indicate estimated effective contrast ratios. Shaded areas represent ±1 Standard Error of the Mean (SEM) of the fits. The goodness-of-fit was assessed with the r2 statistic. (a) An individual with strabismic amblyopia (8 yrs, ET 6Δ, Fuses); (b) An individual with anisometropic amblyopia (9 yrs, ortho); (c) An individual with strabismus (7 yrs, XT 20Δ, Fuses); (d) A normally-sighted individual (7 yrs, ortho); (e) A normally-sighted individual (6 yrs, ortho); (f) A normally-sighted individual (5 yrs, ortho); (g) Correlation between effective contrast ratio and age (year). *ET: Esotropia, XT: Exotropia, Δ: Prism diopter, FU: Fuses, OD: Right eye, OS: Left eye. Note that the reported ocular deviation and fixational information are those made at near fixation (see Figs S1 and S2 for the data from all individual subjects).

