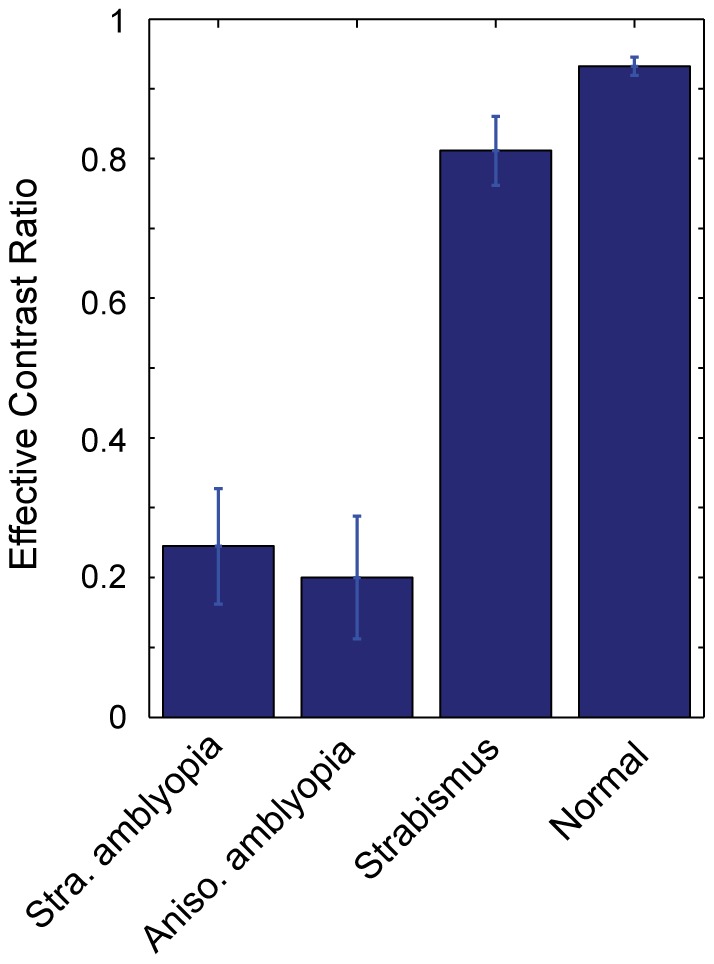
Figure 3. Mean effective contrast ratios for the four subject groups.

Mean effective contrast ratio as a function of subject group. Error bars represent ±1 Standard Errors of the Mean (SEM).

Mean effective contrast ratio as a function of subject group. Error bars represent ±1 Standard Errors of the Mean (SEM).