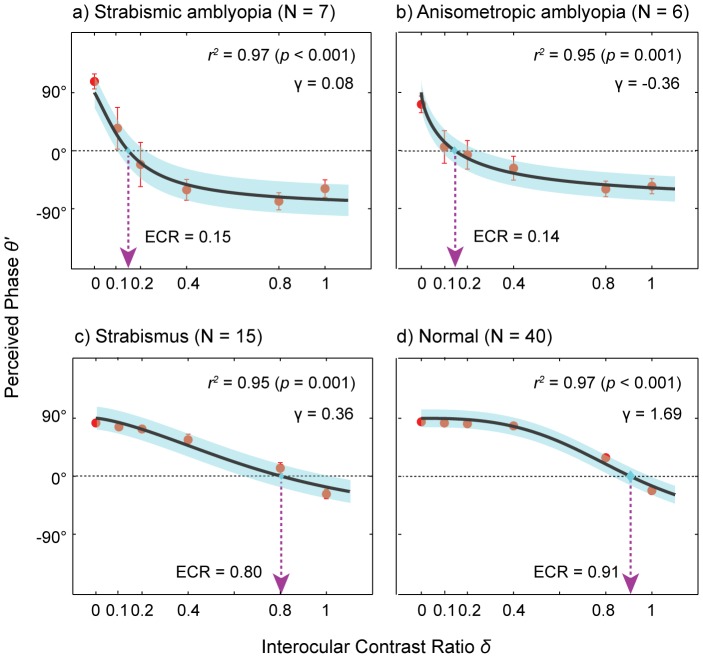
Figure 4. Group average data.
Perceived phase plotted as a function of interocular contrast ratio for each subject group. The bootstrap resampling method [43] was performed to estimate the mean and standard errors of the data for each subject group. Each panel contains the average data (red circles) from each subject group. The average data were fitted with the attenuation model (Eq. 4) to obtain the effective contrast ratio of the weak eye. The black solid lines are the best fits of the model. The dotted arrow lines (magenta color) indicate estimated effective contrast ratios. Shaded areas represent ±1 SEM of the fits. The goodness-of-fit was evaluated by the r2 statistic: (a) Strabismic amblyopia; (b) Anisometropic amblyopia; (c) Strabismus; (d) Normal.

