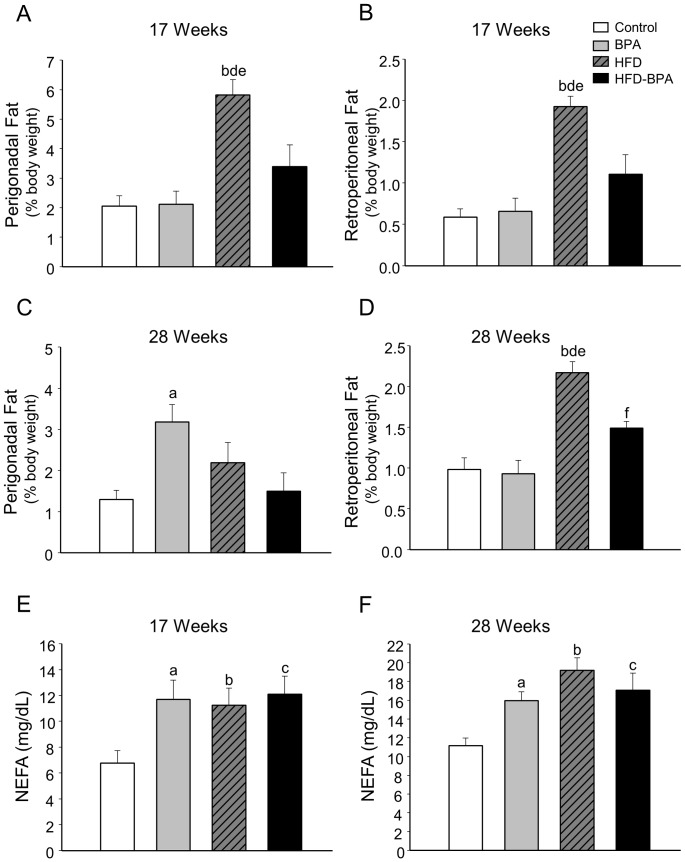
Figure 2. Adipose tissue weight and plasma NEFA levels in offspring.
A) Perigonadal and B) Retroperitoneal fat depots, expressed as % of body weight at 17 weeks old (n = 8 animals from 5–8 litters). C) Perigonadal and D) Retroperitoneal fat depots, expressed as % of body weight at 28 weeks old. (n = 6–8 animals from 5–8 litters). E) Plasma Nonesterified fatty acids (NEFAs) levels at 17 weeks old (n = 7–9 animals from 7 litters) and F) 28 weeks old (n≥5 animals from 4–7 litters). Data are expressed in mean ±SEM; significance p<0.05 by one way ANOVA followed by Holm-Sidak or Dunnett's method; a control vs. BPA; b control vs. HFD, c control vs. HFD-BPA, d HFD vs. BPA, e HFD vs. HFD-BPA, f BPA vs. HFD-BPA.

