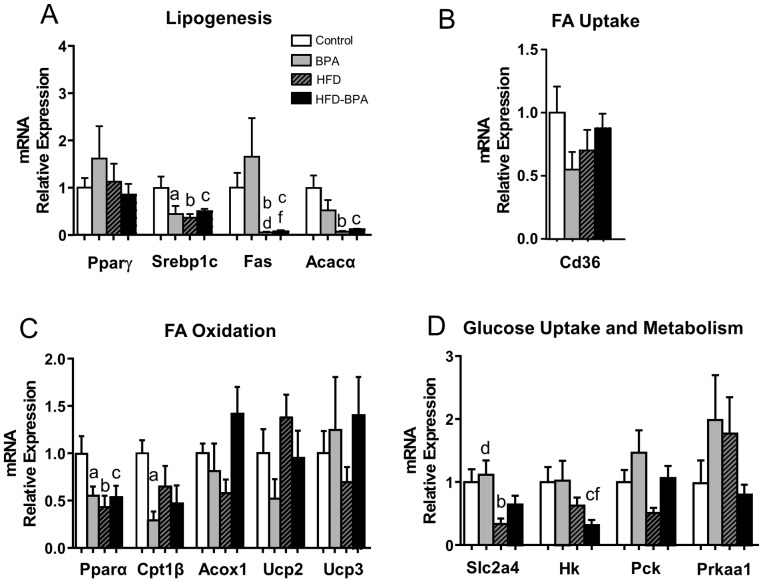
Figure 5. mRNA gene expression associated with A) Lipogenesis, B) Fatty Acid Uptake, C) Fatty Acid Oxidation and D) Glucose Uptake and Metabolism, in White Adipose Tissue (WAT) from Control (n≥5 animals from ≥5 litters), BPA (n≥5 animals from ≥5 litters), HFD (n≥5animals from ≥5 litters) and HFD-BPA (n≥5 animals from ≥5 litters) dams at 17 weeks old.
Animals were treated with HFD at week 4. Gene expression was assessed by real-time RT-PCR. Data are expressed as mean±SEM and statistical significance was determined using one way ANOVA followed by Tukey, Duncans or Dunn's method. Significance p<0.05; a compared control vs. BPA; b control vs. HFD, c control vs. HFD-BPA, d HFD vs. BPA, e HFD vs. HFD-BPA, f BPA vs. HFD-BPA.

