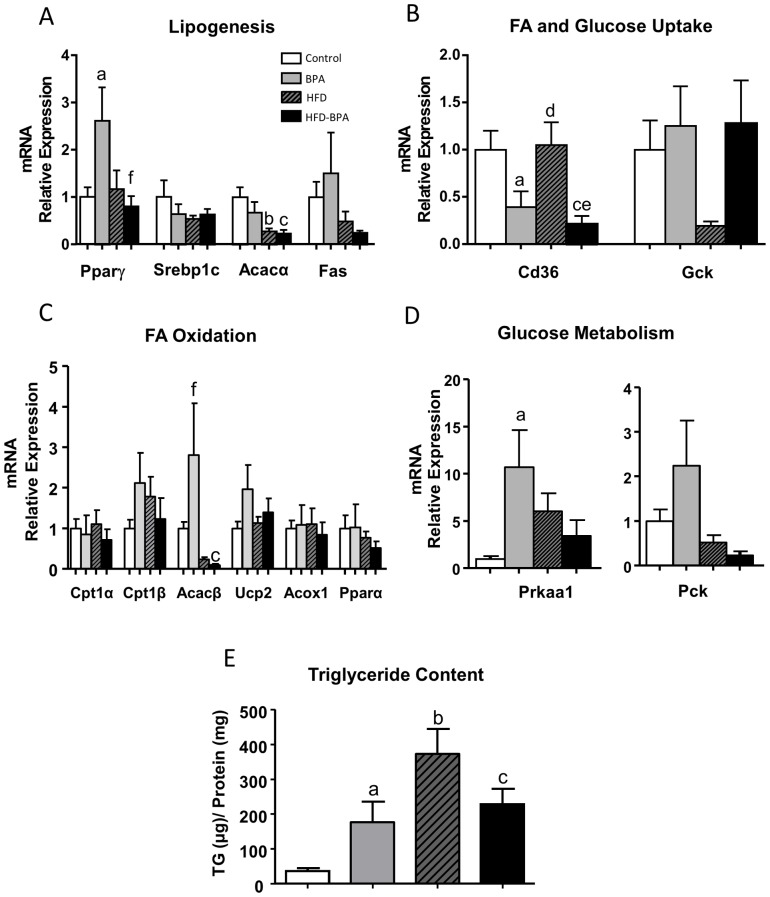
Figure 6. mRNA gene expression associated with A) Lipogenesis, B) Fatty Acid and Glucose Uptake, C) Fatty Acid Oxidation and D) Glucose Metabolism, in the liver from Control (n≥5animals from ≥5 litters), BPA (n≥5 animals from ≥5 litters), HFD (n≥5 animals from ≥5 litters) and HFD-BPA (n≥5 animals from ≥5 litters) dams at the age of 17 weeks.
Animals started to be treated with HFD at the age of 4 weeks. Gene expression was assessed by real-time RT-PCR. E) Hepatic trygliceride content from Control (n≥5animals from ≥5 litters), BPA (n≥5 animals from ≥5 litters), HFD (n≥5 animals from ≥5 litters) and HFD-BPA (n≥5 animals from ≥5 litters) dams at the age of 17 weeks. Data are expressed as mean±SEM and statistical significance was determined using one way ANOVA followed by Tukey or Dunn's method. Significance p<0.05; a compares control vs. BPA; b control vs. HFD, c control vs. HFD-BPA, d HFD vs. BPA, e HFD vs. HFD-BPA, f BPA vs. HFD-BPA.

