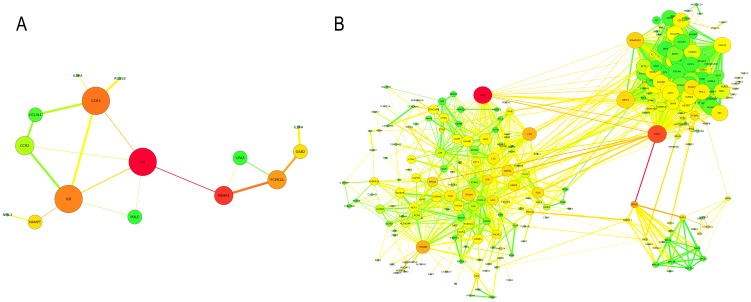
Figure 3. Functional-based networks analyzed in each enriched CD4+ T cell gene expression module.
A: Functional-based network obtained from the immunologically enriched M9 gene expression module. B: Functional-based network obtained from the immunologically enriched M12 gene expression module. The dimensions of each node (i.e. gene) are proportional to its DC value and its color is based on its BC value, ranging from green (lowest BC values) to red (highest BC values). The edge width is proportional to the strength of the functional association evidences between two genes. The edge betweenness determines the edge color, ranging from green (edges connecting nodes with the lowest BC values) to red (edges connecting nodes with the highest BC values).

