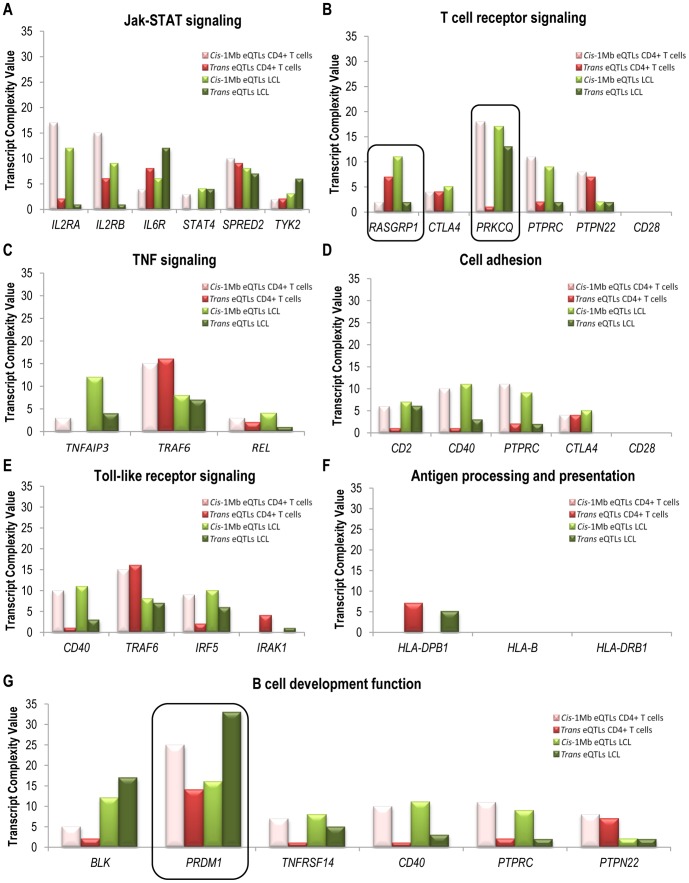
Figure 4. Transcript Complexity Value analysis of RA risk genes.
TCV from the RA CD4+ T cell and control LCLs analyzed in RA risk genes. A: JAK-STAT signaling pathway. B: T cell receptor signaling pathway. C: TNF signaling pathway. D: Cell adhesion pathway. E: Toll-like receptor signaling pathway. F: Antigen processing and presentation pathway. G: B cell development function pathway. The genes that are framed represent those genes showing significant genomic regulation profiles between RA CD4+ T cells and LCLs (P<0.05).

