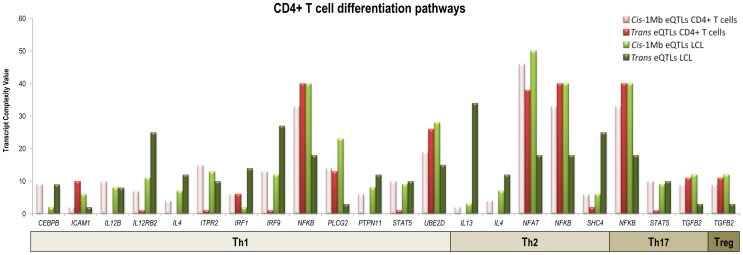
Figure 5. Transcript Complexity Value analysis of T cell differentiation genes.
The type and quantity of significant eQTLs in RA CD4+ T cells and LCL cells are compared in the genes from the Th1, Th2, Th17 and Treg differentiation pathways. Only those genes showing a significantly different genomic regulation profile (P<0.05) are shown.

