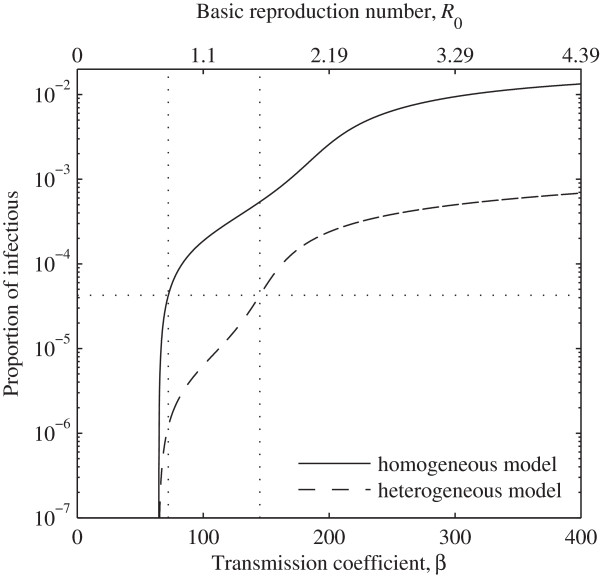
Figure 3.

Prevalence of active TB as a function of transmission parameters. Proportion of infectious individuals as a function of β and R0. Curves represent the endemic equilibria according to the homogeneous system (1) (full line) and the heterogeneous system (3) (dashed line), using parameter values specified in Table 1. Estimates of β and R0 for the same proportion of infectious individuals under both models are marked (dotted lines).
