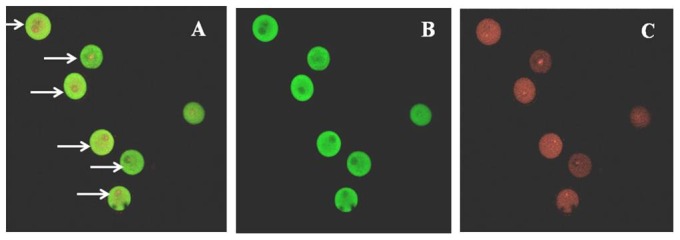
Figure 2. The subcellular location of TAGLN2 was measured by immunofluorescence.

TAGLN2 was labeled with green fluorescence, while cell nuclei and cell membrane were shown as red fluorescence. A)merge; B)Green fluorescence; C)Red fluorescence(10×20, n = 3).
