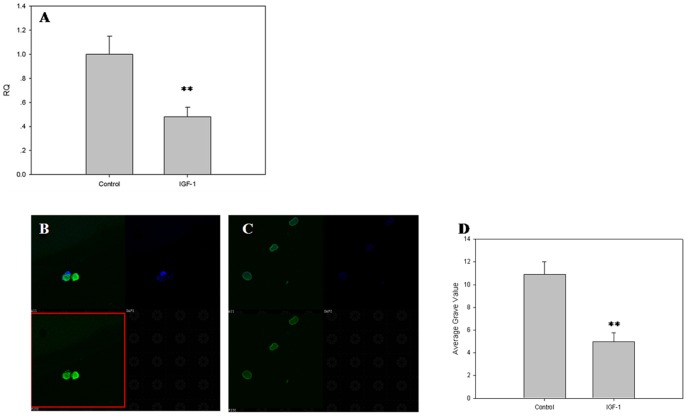
Figure 3. The expression of TAGLN2 at the human oocyte.
After treatment with IGF-1 for 24 hours, the expression levels of TAGLN2 in human ovary were analyzed by real-time PCR and immunofluorescence: A) The expression levels of TAGLN2 in human ovary; B) The expression levels of TAGLN2 in human ovary; C) The expression levels of TAGLN2 in human ovary after treatment with IGF-1; D) Average gray value. Each sample was tested in triplicate and the data were presented in mean ± SD. The experiments were repeated twice and similar results were obtained (mean±SD, n = 3, **P<0.01).

