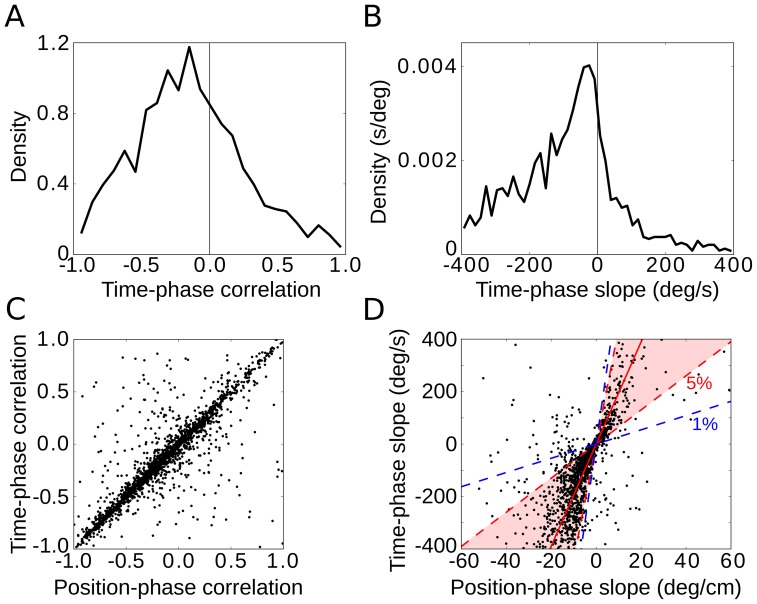
Figure 4. Phase precession in time.
Negative values of time-phase correlation (A) and time-phase slope (B) of single runs indicate phase precession. (C) Time-phase correlation and position-phase correlation are statistically indistinguishable in single runs. (D) Time-phase slope and position-phase slope are highly correlated. The slope of the solid red line indicates the median of average speeds (19.5 cm/s) in single runs. Red and blue dashed lines mark 5-percentiles (6.5 cm/s and 44.1 cm/s, region shown in magenta) and 1-percentiles (2.7 cm/s and 59.9 cm/s) of the speed distribution, respectively. These data show that the variability between the phase-time and phase-position slope is mainly due to variations of the animals' running speed.

