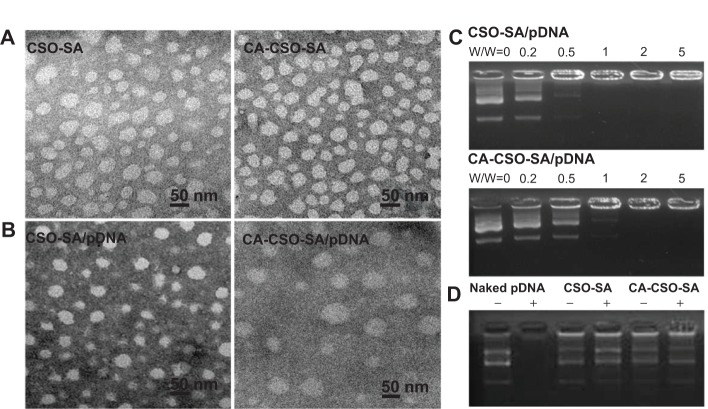
Figure 2.
(A) Transmission electron micrographs of CSO-SA and CA-CSO-SA micelles. (B) Transmission electron micrographs of CSO-SA/pDNA and CA-CSO-SA/pDNA nanoparticles (at a weight ratio of 5). (C) Gel retardation analyses of CSO-SA/pDNA and CA-CSO-SA/pDNA nanocomplexes, where lanes 1–6 show weight ratios of 0, 0.2, 0.5, 1, 2, and 5, respectively. (D) DNase I protection assay, where lanes 1–6 represent naked pDNA, naked pDNA + DNase I, CSO-SA/pDNA, CSO-SA/pDNA + DNase I, CA-CSO-SA/pDNA, and CA-CSO-SA/pDNA + DNase I, respectively.
Notes: CSO-SA/pDNA and CA-CSO-SA/pDNA nanocomplexes prepared at a weight ratio of 2.5. After inactivation by DNase, heparin was added to disassemble the polyplexes.
Abbreviations: CA, cis-aconitate; SA, stearic acid; CSO, chitosan oligosaccharide; pDNA, plasmid DNA; w/w, weight ratio.

