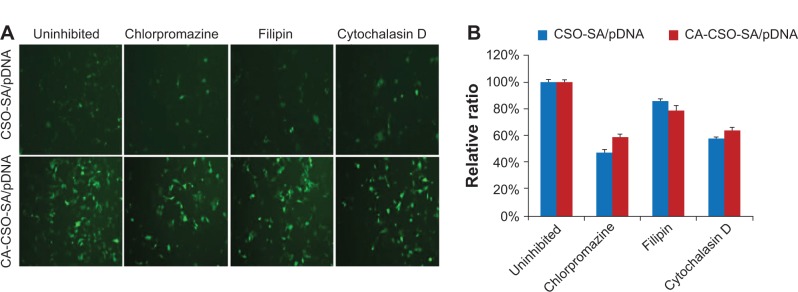
Figure 6.

Fluorescence images (A) and relative ratios of fluorescence intensity compared with uninhibited group (B) of enhanced green fluorescent protein in cells, which were pretreated with inhibitors and then transfected with CSO-SA/pDNA or CA-CSO-SA/pDNA for 72 hours. The uninhibited group indicated group without inhibitor treatment.
Abbreviations: CA, cis-aconitate; SA, stearic acid; CSO, chitosan oligosaccharide; pDNA, plasmid DNA.
