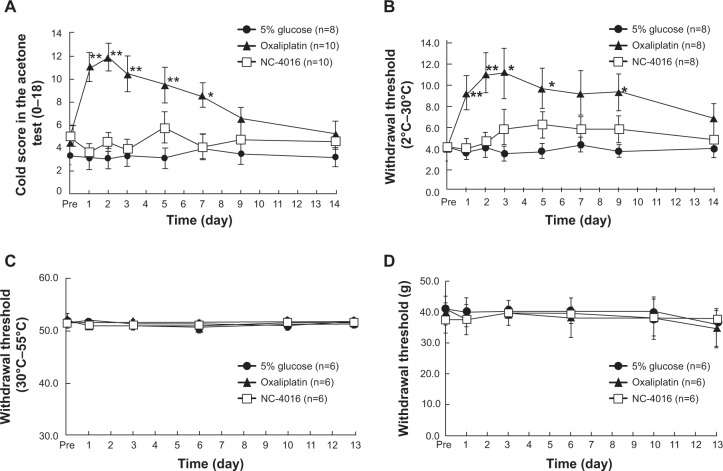
Figure 4.
Changes in cold sensitivity score (A), cold threshold temperature (B), heat threshold temperature (C), and mechanical threshold (D), following administration of either oxaliplatin, NC-4016, or 5% glucose (control).
Notes: Data are presented as mean ± SEM. Data were analyzed using a two-way repeated-measures ANOVA, followed by the Bonferroni post hoc test. *P<0.05, **P<0.01 compared with 5% glucose (control).
Abbreviations: ANOVA, analysis of variance; SEM, standard error of the mean.

