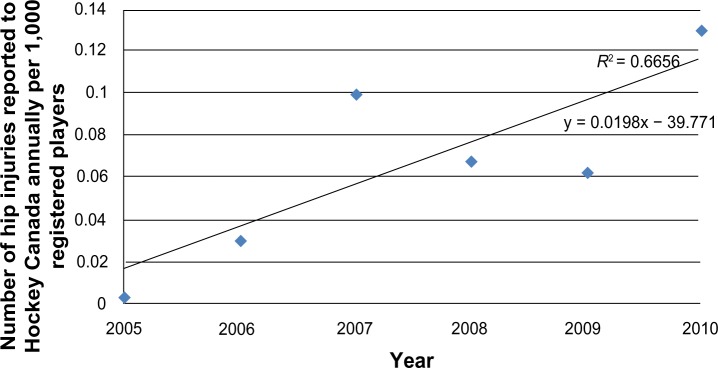
Figure 3.

Plotted is the rate of hip injury reporting to Hockey Canada per 1,000 registered participants annually from 2005 to 2010.
Notes: Age groups from Peewee to Senior are represented each year. Regression analysis yields an annually increasing rate of reporting of 0.02 cases a year.
