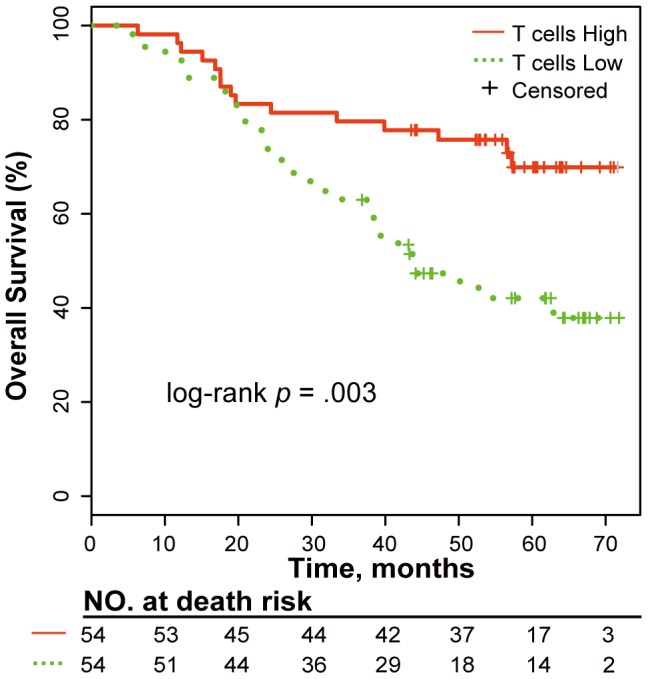
Figure 1. Kaplan-Meier curves for patients stratified by the proportion of T cells.

The patients were stratified into two groups based on the median of the T cell proportion among the NSCLC patients: Low (less than the median) and High (greater than or equal to the median). The median overall survival (OS) was assessed using the Kaplan-Meier analysis. p was calculated using the log-rank test.
