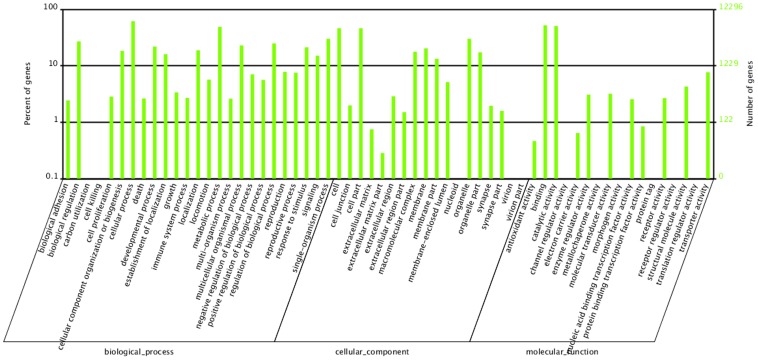
Figure 3. Classification of the gene ontology (GO) for the transcriptome of Propylaea japonica.
Transcripts (12,296) were categorized into 60 function groups. The right y-axis indicates the number of genes in a category, whereas the left y-axis indicates the percentage of a specific category of genes in that main category.

