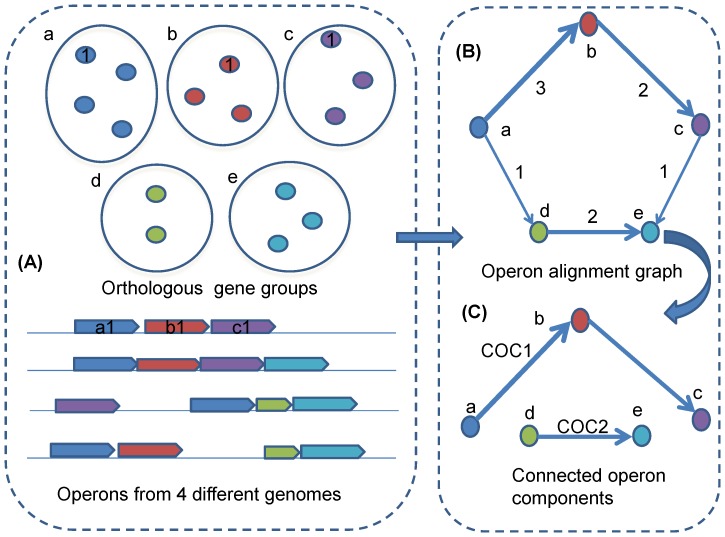
Figure 1. Methodology outline.
(A) Five orthologous gene groups and operons from four different genomes are given as an example; (B) Operon alignment graph with edge weight indicating the number operon pairs can be aligned to the edge; (C) The connected operon components are identified by removing the edges of weight one.

