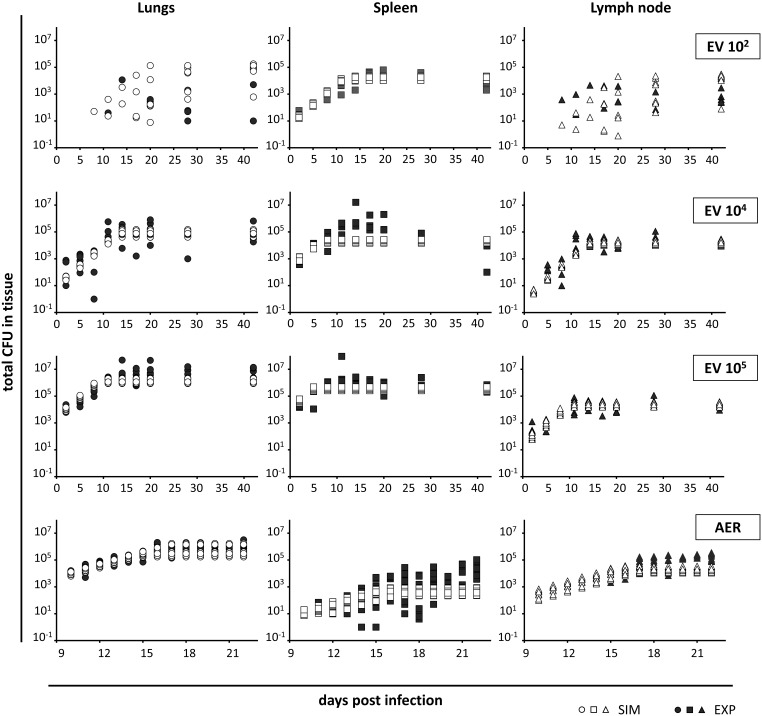
Figure 1. Output of the in silico model and the corresponding experimental results.
The output of the in silico model (white symbols) are represented considering EV infections of 102, 104 and 105 CFU/mL and an AER infection. The experimental results are represented by black symbols. The results are shown individually for each organ (lungs (circles), spleen (squares) and lymph node (triangles)). Ten repetitions of each simulation were performed by changing the random seed. Each experimental point corresponds to an individual mouse.

