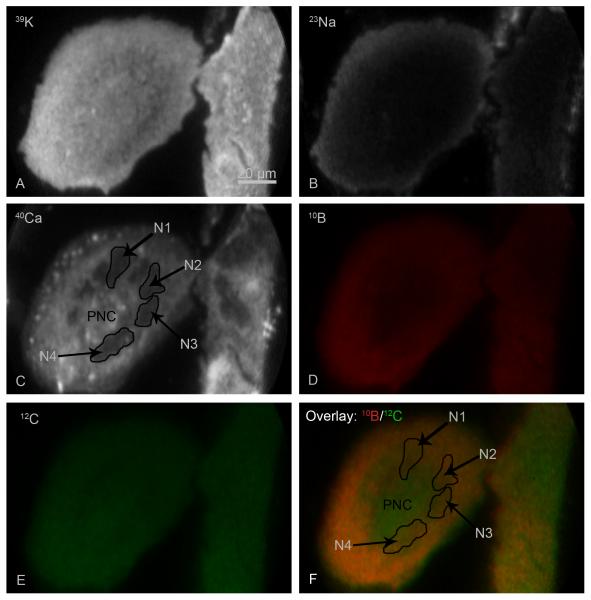
Fig. 5.
The SIMS imaging analysis of a multinucleated giant glioblastoma cell from a 2 hr treatment with 110 μg/g boron equivalent of 10BPA. SIMS images revealing the subcellular distribution of designated isotopes are shown in panels A-E. The 10B image (D) is shown in red and the 12C image in green (E). The overlay image of 10B/12C illustrates boron gradients in yellow, via mixing of red and green, in the giant cell (F). The position of 4 nuclei, designated as N1-N4, and the perinuclear region (PNC) in the giant cell is illustrated in the 40Ca (C) and the overlay image panel (F). The image integration times for 39K and 23Na images were 0.4 s. The 40Ca, 12C, and 10B images were integrated for 2 min each.

