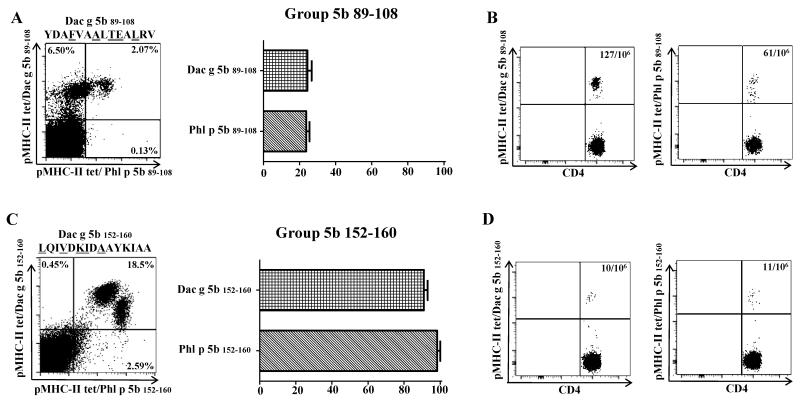
Figure 6.
Grass-pollen-specific CD4+ T-cells have varying degrees of cross-reactivity that vary on the HLA and epitope they recognize. A. PBMC (n=2) from DR07:01 allergic subjects were stimulated in vitro with Dac g peptide corresponding to region Group 5b 89-108. Cells were then co-stained with APC-labeled DR07:01/Phl p grass peptide-loaded tetramers (Y axis) as well as PE-labeled DR0701/Dac g 5b peptide-loaded tetramers (X axis). The plot shows a representative result for Group 5 89-108 grass homologs, sequence of stimulating peptide is shown on top of plot. T-cells were gated on Sidescatter and CD4+. The graph represents percentage of T-cells that were able to double stain; for this particular HLA-restriction minimal cross-reactivity was detected stimulating with either Dac g 5b or Phl p 5b peptides (about 20% of T-cells double stained) B. Ex vivo frequency of allergen-specific CD4+ T-cells for Group 5b 89-108 homologs. C. PBMC (n=2) from DRB5 allergic subjects were stimulated in vitro with either Dac g peptide corresponding to region Group 5b 152-160. Cells where then co-stained with APC-labeled DRB5/Phl p grass peptide-loaded tetramers (Y axis) as well as PE-labeled DRB5/Dac g 5b peptide-loaded tetramers (X axis). The plot shows a representative result for Group 5b 152-160 grass homologs, sequence of stimulating peptide is shown on top of plot. T-cells were gated on Side scatter and CD4+. The graph represents percentage of double stained T-cells, for this particular HLA-restriction full scale cross-reactivity was detected stimulating with either Dac g 5b or Phl p 5b peptides (≥ 90% of T-cells double stained) D. Ex vivo frequency of allergen-specific CD4+ T-cells for Group 5 152-160 grass homologs.

