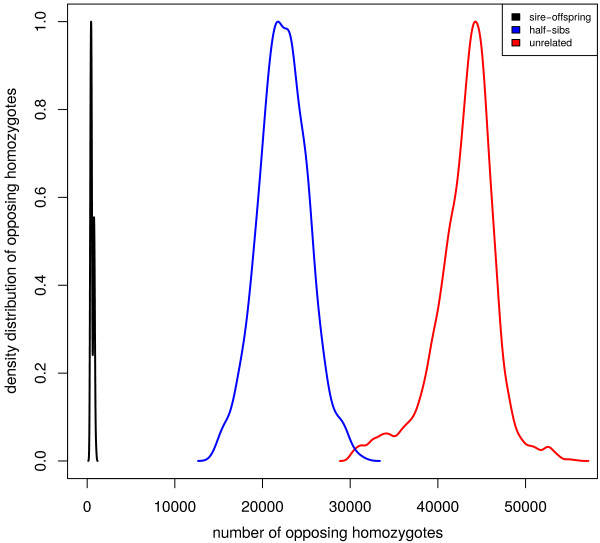
Figure 1.

Density plot of opposing homozygotes. The three distributions show the number of opposing homozygotes between parents and offspring (black), between half-sib families (blue) and between unrelated individuals (red). The distributions are genome wide and based on 290 Hanwoo cattle from 36 sires genotyped on the 700 k Illumina BeadChip. The separation between parent-offspring and other relationships is very clear but there is some level of overlap between the distributions of half-sibs and unrelated animals which can make it not possible to perfectly characterize family groups. The level of separability is conditional on the overall genetic variation in the population and is better with genetically diverse populations. For reference purposes, Hanwoo cattle have small effective population size (~100) and are subject to some ascertainment bias in the array design which further constrains detectable variation.
