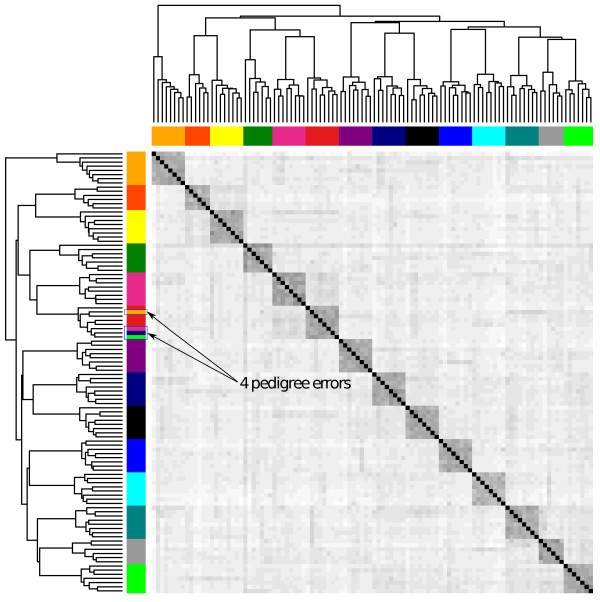
Figure 4.

Correction of pedigree errors. The heatmap shows the relationships between individuals based on opposing homozygotes. Half-sib families are colour coded. On the vertical bar (left-hand side), 4 individuals are misclassified in the phenotypic pedigree. The horizontal bar (top) shows the reconstructed pedigree using the rpoh function in hsphase. Data is for 106 Hanwoo cattle from 14 family groups genotyped on the 700 k Illumina BeadChip array. Four pedigree records were purposely swapped. The darker blocks on the diagonal help identify half-sib groups.
