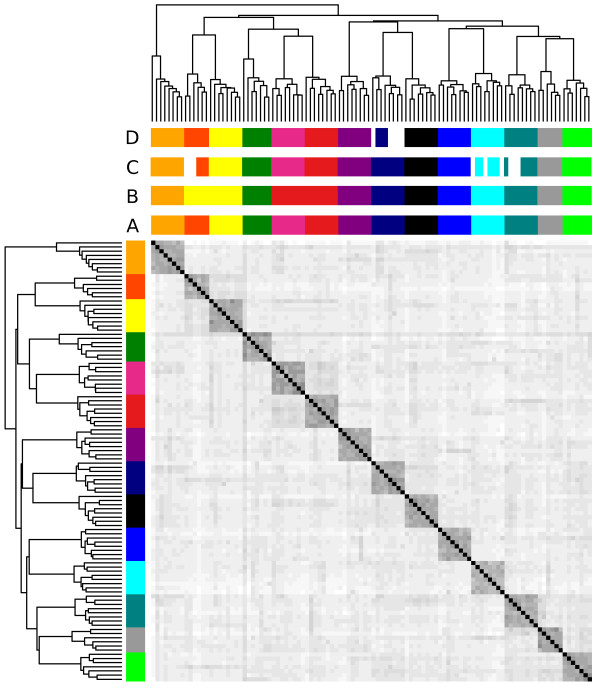
Figure 8.

Comparison of pedigree reconstruction methods. Left-hand side colour bars for true family relationships, top-side bars for inferred pedigree and pedigree matching. The top colour bars are respectively, A) Manually determined threshold for number of opposing homozygotes in a half-sib family (31,662). The pedigree is 100% accurate and correctly assigned to the sires. B) Regression coefficients derived from a large sheep population. Two families did not separate (yellow and red – top bar) and were classified as a two groups instead of four. C) The third method based on [12] failed to assign 9 individuals to their correct sire (unassigned individuals shown in white). Method four uses number of recombinations to sort family groups. Here chromosome one was used with a maximum of 10 recombinations allowed. The method failed to group 5 individuals from one family (unassigned individuals shown in white).
