
Figure 5.
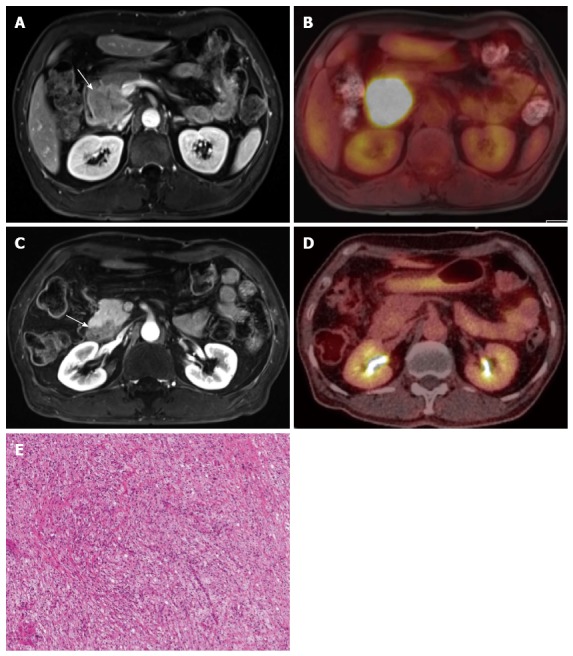
Treatment monitoring of pancreatic cancer using positron emission tomography/magnetic resonance. A, B: A 5-cm mass of biopsy-proven, adenosquamous carcinoma (arrow) in the pancreatic head, as seen due to the strong FDG uptake; C, D: The mass (arrow) shows a marked decrease in size and glucose metabolism (from 22.0 to 3.8 of mSUV) after six cycles of neoadjuvant concurrent chemoradiation treatment. The specimen obtained during the following surgery revealed complete remission; E: All tumor cells are replaced by a foamy histiocytes collection of cholesterol clefts and multinucleated giant cells. PET: Positron emission tomography; MR: Magnetic resonance; FDG: Fluorodeoxyglucose; mSUV: Maximum standardized uptake value.