
Figure 1.
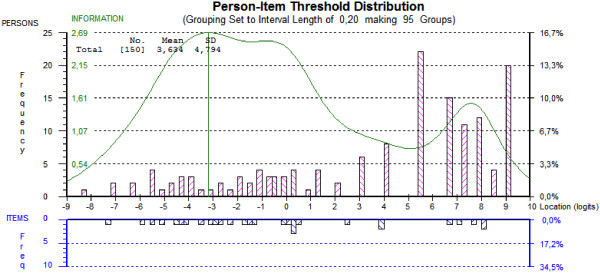
Targeting of persons and items. The figure illustrates the ability of the SwePASS to cover the range of the latent trait, postural control, in the study population. This is done by comparing the distribution of persons (upper plot) and items (lower plot) on the same logit scale, based on the final solution for SwePASS. Towards the right of the scale, postural control increases. Perfect matching happens when both the distributions of persons do not fall outside the distribution of items and when distributions have a mean of zero logits.