Figure 2.
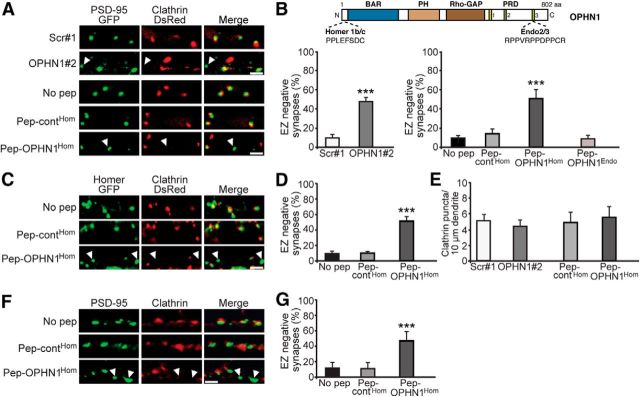
OPHN1–Homer interaction is required for positioning EZ near PSD. A, Representative images of CA1 neurons expressing PSD-95-GFP and clathrin-DsRed together with indicated shRNA, or treated with indicated peptides. Scale bars, 2 μm. Arrowhead depicts EZ-negative synapse. B, Top, Domain structure of OPHN1. Homer1b/c and Endo2/3 binding sites are indicated. Bottom, Quantitative analysis of EZ-negative synapses. Error bars represent SEM; n = 268–414 (shRNA-experiment) and 504–1045 (peptide-experiment) spines/synapses, ***p < 0.001 against scr#1 for shRNA experiment (Student's t test) and against no pep for peptide experiment (one-way ANOVA). C, Representative images of CA1 neurons expressing Homer-GFP and clathrin-DsRed and treated with indicated peptides. Scale bar, 2 μm. D, Quantitative analysis of EZ-negative synapses. Error bars represent SEM; n = 778–839 spines/synapses, ***p < 0.001 against no pep (one-way ANOVA). E, Quantitative analysis of clathrin puncta. Error bars represent SEM; n = 6–8 neurons/condition, p > 0.05 against scr#1 or pep-contHom (Student's t test). F, Representative images of dissociated hippocampal neurons (18–20 DIV) treated with indicated peptides and immunostained for endogenous PSD-95 and clathrin heavy chain. G, Quantitative analysis of EZ-negative synapses. Error bars represent SEM; n = 828–912 spines/synapses, ***p < 0.001 against no pep (one-way ANOVA).

