Figure 3.
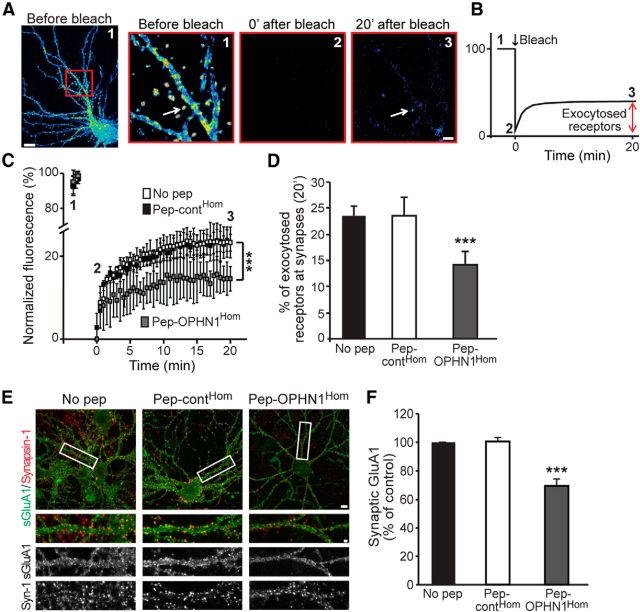
Disruption of OPHN1–Homer interaction reduces the number of newly exocytosed AMPARs at synaptic sites in basal synaptic conditions. A, Representative pseudocolor images of SEP-GluA1 fluorescence in dendrites of cultured hippocampal neurons before (1), just after (2), and 20 min after (3) exposure to large bleach in boxed region. Arrow depicts example of SEP fluorescence return in spine after bleach. Scale bars, Left, 10 μm; right, 2 μm. B, Schematic of the experiment. C, Quantification of SEP-GluA1 fluorescence at synapses of neurons expressing SEP-GluA1 and mCherry-Homer and pretreated with no pep, pep-contHom, or pep-OPHN1Hom, before and after bleach at indicated time points. D, Quantitative analysis of SEP-GluA1 exocytosis at synapses 20 min after bleach. Error bars represent SEM; n = 237–645 synapses (for C and D), ***p < 0.001 against no pep (one-way ANOVA). E, Representative images of surface GluA1 in neurons pretreated with indicated peptides before antibody labeling assay. Synapsin-1 was used to mark synapses. Bottom, Enlarged view of dendritic segment boxed at the top. Scale bars, Top, 10 μm; bottom, 2 μm. F, Quantification of number of surface GluA1 puncta at synapses; n = 32–35 neurons from 3 cultures/condition. Error bar indicates SEM, ***p < 0.001 against no pep (one-way ANOVA).

