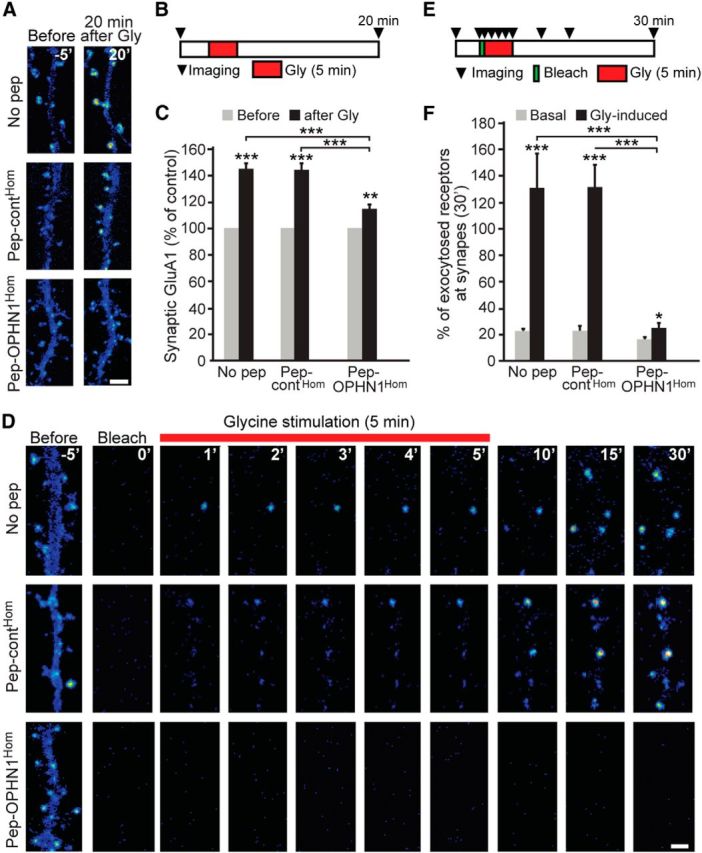
Figure 4.

OPHN1–Homer interaction is essential for glycine-induced increase in receptor recycling/exocytosis and synaptic AMPAR number. A, Representative pseudocolor images of SEP-GluA1-expressing neurons pretreated with indicated peptides, taken 5 min before and 20 min after glycine stimulation. Scale bar, 2 μm. B, Schematic diagram for experiment in A. C, Quantification of surface synaptic SEP-GluA1 before and 20 min after glycine stimulation. Error bars represent SEM; n = 142–267 spines/synapses, **p < 0.01, ***p < 0.001 (t test, unpaired). D, Representative pseudocolor images of dendrites of SEP-GluA1-expressing neurons pretreated with indicated peptides, taken before bleach, just after bleach, and following glycine stimulation at indicated time points. Scale bar, 2 μm. In A and D, mCherry-Homer or tDimer was coexpressed to label synapses/spines; not depicted for clarity. E, Schematic diagram for experiment in D. F, Quantitative analysis of glycine-induced SEP-GluA1 exocytosis at synapses 30 min after bleach. Error bars represent SEM; n = 101–220 spines/synapses, *p < 0.05, ***p < 0.001 (t test, unpaired).
