Figure 2.
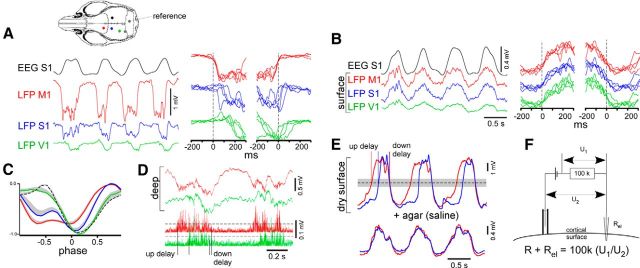
LFP/EEG recordings in the mouse cortex. A, Simultaneously recorded LFP and EEG activities in the motor, somatosensory, and visual cortex in deep layers (0.7–0.9 mm) as estimated from manipulator reading. The location of electrodes is schematically shown by colors on the mouse skull drawing. Left, Superposition of the beginning and the end of active states at a higher temporal resolution. B, LFP activities recorded from the wet cortical surface at the same points as in A. C, Averaged LFP waves from deep layers plotted against phase. In each animal (n = 6 mice), 2 min segments of LFPs were recorded simultaneously by pairs from M1 and successively in S1, and then V1, and RS (dotted line, the cortical area is shown by dotted point on the mouse skull drawing). Before averaging in a group, waves were normalized by maximum values. The positive part of SEM is shown with gray (negative part is not shown). D, An example of paired LFPs from deep layers in M1 and V1 and lower the corresponding absolute values of γ (50–300 Hz) activities are shown. The delays between γ LFP signals were detected using the crossings with the thresholds (7 SD of silent state activities). E, An example of paired LFPs from dry cortical surface in M1 and S1 before and after (bottom traces) of agar application on the cortex. The delays between LFP signals were detected using the crossings with half of wave amplitude. On average, the delays were insensitive to the threshold amplitude within significant range (shown with gray). F, The circuit that was used to measure a passive impedance of the cortex. The pipettes were filled with 3 m NaCl in 4% agar to avoid leakage, and chlorinated silver wires were used inside the pipette. Sinusoidal potential was applied for measurements (2 Hz, amplitude 0.4 V).

