Figure 6.

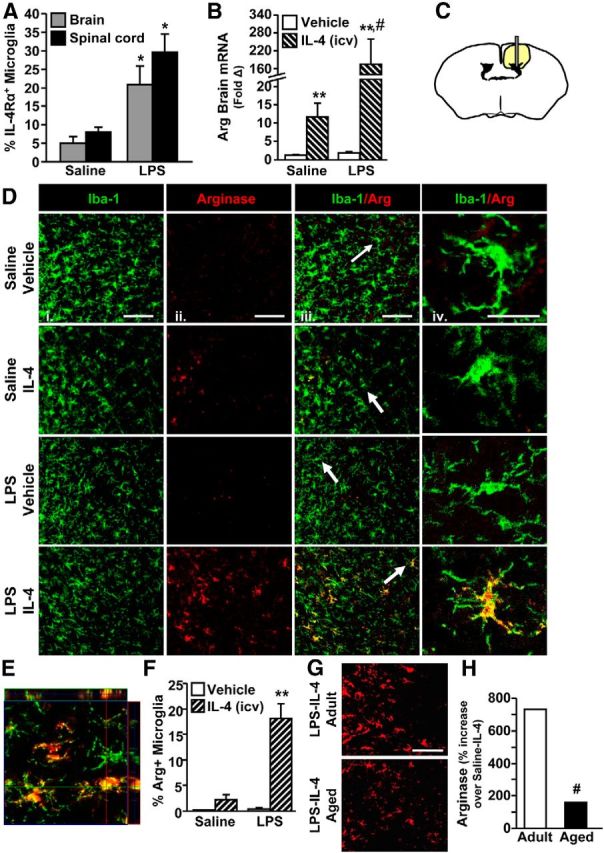
IL-4Rα induction on activated microglia was required for IL-4-dependent arginase expression. Adult (3 months) male BALB/c mice received an intraperitoneal injection of saline or LPS and 1 h later received an intracerebroventricular (icv) injection of vehicle or IL-4. Brains and spinal cords were collected 24 h after LPS. A, Enriched microglia were isolated from the brain and enriched CD11b+ cells were isolated from the spinal cord. Average percentage of IL-4Rα+ microglia by flow cytometry (n = 2–3). B, mRNA expression of arginase (Arg) from a 1 mm coronal section at the intracerebroventricular injection site (n = 8–18). C, Schematic of the area where images were collected for Iba-1/Arg labeling. D, Representative images of Iba-1 (i), Arg (ii), and Iba-1/arginase (iii) labeling. Scale bars, 100 μm. White arrows indicate microglia used for higher magnification in iv. Scale bar, 25 μm. E, Representative image for orthogonal analysis of colocalization for Iba-1 (green)/Arg (red) labeling. F, Percentage Iba-1+/Arg+ microglia (n = 3–4). G, A separate subset of adult (3 months) and aged (20 months) male BALB/c mice were given Sal/LPS and Vehicle/IL-4 injections as above. Brains were collected 24 h after LPS. Representative images for Arg staining. Scale bar, 50 μm. H, Percentage increase in Arg staining for LPS-IL-4 mice compared with age-matched Saline-IL-4 controls (n = 3). Error bars represent the mean ± SEM. Means with *p < 0.05 are significantly different from Saline controls. Means with **p < 0.01 are significantly different from Saline-Vehicle controls. Means with #p < 0.01 are significantly different from Adult-Saline-IL-4.
