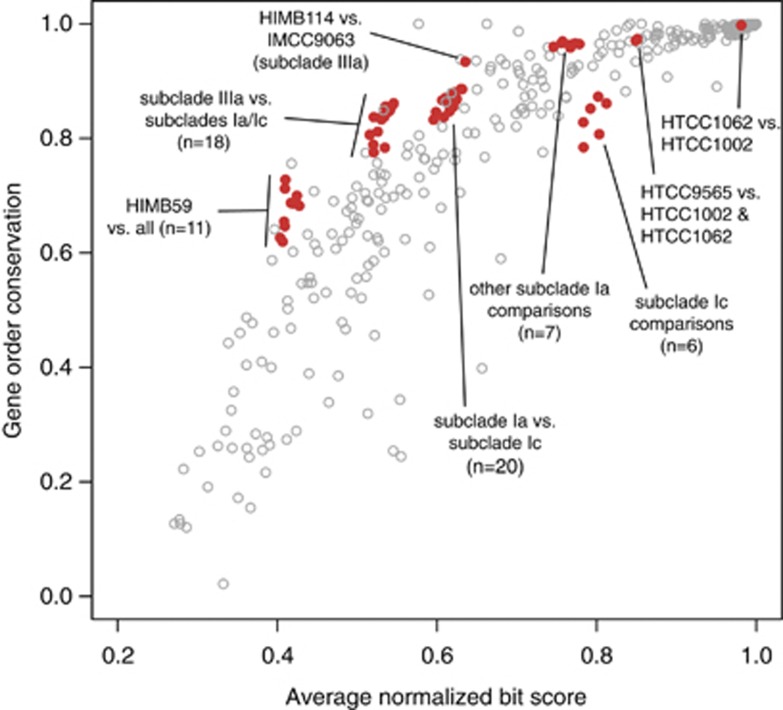
Figure 4.
Local synteny in SAR11 genomes. The percentage of genes in conserved order relative to the total number of shared genes (gene order conservation) vs average normalized bit score of the shared amino-acid content. Red dots are all pairwise comparisons of SAR11 genomes, the total in a given area indicated by n. Data are overlaid on that from Yelton et al. (2011; open gray circles).

